
This entry is from Wikipedia, the leading user-contributed encyclopedia.
• Primary structure
• Protein purification
• Protein sequencing
• Protein mass spectrometry
• Proteomics
• ELISA
• Western blot
Primary structure
In biochemistry, the primary structure of a biological molecule is the exact specification of its atomic composition and the chemical bonds connecting those atoms (including stereochemistry). For a typical unbranched, un-crosslinked biopolymer (such as a molecule of DNA, RNA or typical intracellular protein), the primary structure is equivalent to specifying the sequence of its monomeric subunits, e.g., the nucleotide or peptide sequence. The term “primary structure” was first coined by Linderstrom-Lang in his 1951 Lane Medical Lectures. Primary structure is sometimes mistakenly termed primary sequence, but there is no such term, as well as no parallel concept of secondary or tertiary sequence.
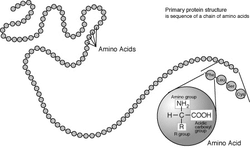
A protein primary structure is a chain of amino acids.
Contents
1. Primary structure of polypeptides
2. Modifications of primary structure
3. History of protein primary structure
4. Relation to secondary and tertiary structure
5. Primary structure in other molecules
6. References
1. Primary structure of polypeptides
In general, polypeptides are unbranched polymers, so their primary structure can often be specified by the sequence of amino acids along their backbone. However, proteins can become cross-linked, most commonly by disulfide bonds, and the primary structure also requires specifying the cross-linking atoms, e.g., specifying the cysteines involved in the protein’s disulfide bonds. Other crosslinks include desmosine…
The chiral centers of a polypeptide chain can undergo racemization. In particular, the L-amino acids normally found in proteins can spontaneously isomerize at the Cα atom to form D-amino acids, which cannot be cleaved by most proteases.
Finally, the protein can undergo a variety of posttranslational modifications, which are briefly summarized here.
The N-terminal amino group of a polypeptide can be modified covalently, e.g.,
• acetylation
The positive charge on the N-terminal amino group may be eliminated by changing it to an acetyl group (N-terminal blocking).
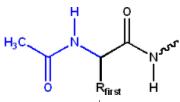
N-terminal acetylation
• formylation
The N-terminal methionine usually found after translation has an N-terminus blocked with a formyl group. This formyl group (and sometimes the methionine residue itself, if followed by Gly or Ser) is removed by the enzyme deformylase.
• pyroglutamate
An N-terminal glutamine can attack itself, forming a cyclic pyroglutamate group.
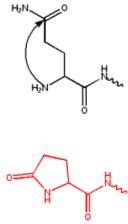
Formation of pyroglutamate from an N-terminal glutamine
• myristoylation
Similar to acetylation. Instead of a simple methyl group, the myristoyl group has a tail of 14 hydrophobic carbons, which make it ideal for anchoring proteins to cellular membranes.
The C-terminal carboxylate group of a polypeptide can also be modified, e.g.,
• amidation
The C-terminus can also be blocked (thus, neutralizing its negative charge) by amidation.
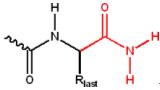
C-terminal amidation
• glycosyl phosphatidylinositol (GPI) attachment
Glycosyl phosphatidylinositol is a large, hydrophobic phospholipid prosthetic group that achors proteins to cellular membranes. It is attached to the polypeptide C-terminus through an amide linkage that then connects to ethanolamine, thence to sundry sugars and finally to the phosphatidylinositol lipid moiety.
Finally, the peptide side chains can also be modified covalently, e.g.,
• phosphorylation
Aside from cleavage, phosphorylation is perhaps the most important chemical modification of proteins. A phosphate group can be attached to the sidechain hydroxyl group of serine, threonine and tyrosine residues, adding a negative charge at that site and producing an unnatural amino acid. Such reactions are catalyzed by kinases and the reverse reaction is catalyzed by phosphorylases. The phosphorylated tyrosines are often used as “handles” by which proteins can bind to one another, whereas phosphorylation of Ser/Thr often induces conformational changes, presumably because of the introduced negative charge. The effects of phosphorylating Ser/Thr can sometimes be simulated by mutating the Ser/Thr residue to glutamate.
• glycosylation
A catch-all name for a set of very common and very heterogeneous chemical modifications. Sugar moieties can be attached to the sidechain hydroxyl groups of Ser/Thr or to the sidechain amide groups of Asn. Such attachments can serve many functions, ranging from increasing solubility to complex recognition. All glycosylation can be blocked with certain inhibitors, such as tunicamycin.
• deamidation (succinimide formation)
In this modification, an asparagine or aspartate side chain attacks the following peptide bond, forming a symmetrical succinimide intermediate. Hydrolysis of the intermediate produces either asparate or the β-amino acid, iso(Asp). For asparagine, either product results in the loss of the amide group, hence “deamidation”.
• hydroxylation
Proline residues may be hydroxylates at either of two atoms, as can lysine (at one atom). Hydroxyproline is a critical component of collagen, which becomes unstable upon its loss. The hydroxylation reaction is catalyzed by an enzyme that requires ascorbic acid (vitamin C), deficiencies in which lead to many connective-tissue diseases such as scurvy.
• methylation
Several protein residues can be methylated, most notably the positive groups of lysine and arginine. Methylation at these sites is used to regulate the binding of proteins to nucleic acids. Lysine residues can be singly, doubly and even triply methylated. Methylation does not alter the positive charge on the side chain, however.
• acetylation
Acetylation of the lysine amino groups is chemically analogous to the acetylation of the N-terminus. Functionally, however, the acetylation of lysine residues is used to regulate the binding of proteins to nucleic acids. The cancellation of the positive charge on the lysine weakens the electrostatic attraction for the (negatively charged) nucleic acids.
• sulfation
Tyrosines may become sulfated on their Oη atom. Somewhat unusually, this modification occurs in the Golgi apparatus, not in the endoplasmic reticulum. Similar to phosphorylated tyrosines, sulfated tyrosines are used for specific recognition, e.g., in chemokine receptors on the cell surface. As with phosphorylation, sulfation adds a negative charge to a previously neutral site.
• prenylation and palmitoylation
The hydrophobic isoprene (e.g., farnesyl, geranyl, and geranylgeranyl groups) and palmitoyl groups may be added to the Sγ atom of cysteine residues to anchor proteins to cellular membranes. Unlike the GPI and myritoyl anchors, these groups are not necessarily added at the termini.
• carboxylation
A relatively rare modification that adds an extra carboxylate group (and, hence, a double negative charge) to a glutamate side chain, producing a Gla residue. This is used to strengthen the binding to “hard” metal ions such as calcium.
• ADP-ribosylation
The large ADP-ribosyl group can be transferred to several types of side chains within proteins, with heterogeneous effects. This modification is a target for the powerful toxins of disparate bacteria, e.g., Vibrio cholerae, Corynebacterium diphtheriae and Bordetella pertussis.
• ubiquitination and SUMOylation
Various full-length, folded proteins can be attached at their C-termini to the sidechain ammonium groups of lysines of other proteins. Ubiquitin is the most common of these, and usually signals that the ubiquitin-tagged protein should be degraded.
Most of the polypeptide modifications listed above occur post-translationally, i.e., after the protein has been synthesized on the ribosome, typically occurring in the endoplasmic reticulum, a subcellular organelle of the eukaryotic cell.
Many other chemical reactions (e.g., cyanylation) have been applied to proteins by chemists, although they are not found in biological systems.
2. Modifications of primary structure
In addition to those listed above, the most important modification of primary structure is peptide cleavage. Proteins are often synthesized in an inactive precursor form; typically, an N-terminal or C-terminal segment blocks the active site of the protein, inhibiting its function. The protein is activated by cleaving off the inhibitory peptide.
Some proteins even have the power to cleave themselves. Typically, the hydroxyl group of a serine (rarely, threonine) or the thiol group of a cysteine residue will attack the carbonyl carbon of the preceding peptide bond, forming a tetrahedrally bonded intermediate [classified as a hydroxyoxazolidine (Ser/Thr) or hydroxythiazolidine (Cys) intermediate]. This intermediate tends to revert to the amide form, expelling the attacking group, since the amide form is usually favored by free energy, (presumably due to the strong resonance stabilization of the peptide group). However, additional molecular interactions may render the amide form less stable; the amino group is expelled instead, resulting in an ester (Ser/Thr) or thioester (Cys) bond in place of the peptide bond. This chemical reaction is called an N-O acyl shift.
The ester/thioester bond can be resolved in several ways:
• Simple hydrolysis will split the polypeptide chain, where the displaced amino group becomes the new N-terminus. This is seen in the maturation of glycosylasparaginase.
• A β-elimination reaction also splits the chain, but results in a pyruvoyl group at the new N-terminus. This pyruvoyl group may be used as a covalently attached catalytic cofactor in some enzymes, especially decarboxylases such as S-adenosylmethionine decarboxylase {SAMDC) that exploit the electron-withdrawing power of the pyruvoyl group.
• Intramolecular transesterification, resulting in a branched polypeptide. In inteins, the new ester bond is broken by an intramolecular attack by the soon-to-be C-terminal asparagine.
• Intermolecular transesterification can transfer a whole segment from one polypeptide to another, as is seen in the Hedgehog protein autoprocessing.
3. History of protein primary structure
The proposal that proteins were linear chains of α-amino acids was made nearly simultaneously by two scientists at the same conference in 1902, the 74th meeting of the Society of German Scientists and Physicians, held in Karlsbad. Franz Hofmeister made the proposal in the morning, based on his observations of the biuret reaction in proteins. Hofmeister was followed a few hours later by Emil Fischer, who had amased a wealth of chemical details supporting the peptide-bond model. For completeness, the proposal that proteins contained amide linkages was made as early as 1882 by the French chemist E. Grimaux.
Despite these data and later evidence that proteolytically digested proteins yielded only oligopeptides, the idea that proteins were linear, unbranched polymers of amino acids was not accepted immediately. Some well-respected scientists such as William Astbury doubted that covalent bonds were strong enough to hold such long molecules together; they feared that thermal agitations would shake such long molecules asunder. Hermann Staudinger faced similar prejudices in the 1920s when he argued that rubber was composed of macromolecules.
Thus, several alternative hypotheses arose. The colloidal protein hypothesis stated that proteins were colloidal assemblies of smaller molecules. This hypothesis was disproven in the 1920s by ultracentrifugation measurements by The Svedberg that showed that proteins had a well-defined, reproducible molecular weight and by electrophoretic measurements by Arne Tiselius that indicated that proteins were single molecules. A second hypothesis, the cyclol hypothesis advanced by Dorothy Wrinch, proposed that the linear polypeptide underwent a chemical cyclol rearrangement C=O + HN → C(OH)-N that crosslinked its backbone amide groups, forming a two-dimensional fabric. Other primary structures of proteins were proposed by various researchers, such as the diketopiperazine model of Emil Abderhalden and the pyrrol/piperidine model of Troensegaard in 1942. Although never given much credence, these alternative models were finally disproven when Frederick Sanger successfully sequenced insulin and by the crystallographic determination of myoglobin and hemoglobin by Max Perutz and John Kendrew.
4. Relation to secondary and tertiary structure
The primary structure of a biological polymer to a large extent determines the three-dimensional shape known as the tertiary structure, but nucleic acid and protein folding are so complex that knowing the primary structure often doesn’t help either to deduce the shape or to predict localized secondary structure, such as the formation of loops or helices. However, knowing the structure of a similar homologous sequence (for example a member of the same protein family) can unambiguously identify the tertiary structure of the given sequence. Sequence families are often determined by sequence clustering, and structural genomics projects aim to produce a set of representative structures to cover the sequence space of possible non-redundant sequences.
5. Primary structure in other molecules
Any linear-chain heteropolymer can be said to have a “primary structure” by analogy to the usage of the term for proteins, but this usage is rare compared to the extremely common usage in reference to proteins. In RNA, which also has extensive secondary structure, the linear chain of bases is generally just referred to as the “sequence” as it is in DNA (which usually forms a linear double helix with little secondary structure). Other biological polymers such as polysaccharides can also be considered to have a primary structure, although the usage is not standard.
6. References
• Iwai K and Ando T. (1967) “N → O Acyl Rearrangement”, Methods Enzymol., 11, 263-282.
• Perler FB, Xu MQ and Paulus H. (1997) “Protein Splicing and autoproteolysis mechanisms”, Curr. Opin. Chem. Biol., 1, 292-299.
• Paulus H. “The chemical basis of protein splicing”, Chem. Soc. Rev., 27, 375-386.
• Hofmeister F. (1902) Naturwiss. Rundschau, 17, 529-545.
• Fischer E. (1902) Autoreferat. Chem. Ztg., 26, 93.
• Troensegaard N. (1942) Über die Struktur des Proteinmoleküls: eine chemische Untersuchung. E. Munksgaard, København (Copenhagen).
• Sanger F. (1952) “The arrangement of amino acids in proteins”, Adv. Protein Chem., 7, 1-67.
• Fruton JS. (1979) “Early theories of protein structure”, Ann. N.Y. Acad. Sci., 325, 1-18.
• Wieland T and Bodanszky M (1991) The World of Peptides, Springer Verlag. ISBN 0-387-52830-X
Protein purification
Protein purification is a series of processes intended to isolate a single type of protein from a complex mixture. Protein purification is vital for the characterisation of the function, structure and interactions of the protein of interest. The starting material is usually a biological tissue or a microbial culture. The various steps in the purification process may free the protein from a matrix that confines it, separate the protein and non-protein parts of the mixture, and finally separate the desired protein from all other proteins. Separation of one protein from all others is typically the most laborious aspect of protein purification. Separation steps exploit differences in protein size, physico-chemical properties and binding affinity.
Contents
1. Purpose
2. Strategies
3. Evaluating purification yield
4. Purification of a tagged protein
5. Methods of protein purification
6. Extraction
7. Precipitation and differential solubilization
8. Ultracentrifugation
9. Chromatographic methods
9.1. Size exclusion chromatography
9.2. Separation based on charge or hydrophobicity
9.3. Ion exchange chromatography
9.4. Affinity chromatography
9.4.1. Metal binding
9.4.2. Immunoaffinity chromatography
9.5. HPLC
10. Concentration of the purified protein
10.1. Lyophilization
10.2. Ultrafiltration
11. Analytical
11.1. Denaturing-Condition Electrophoresis
11.2. Non-Denaturing-Condition Electrophoresis
12. References
13. External links
1. Purpose
Purification may be preparative or analytical. Preparative purifications aim to produce a relatively large quantity of purified proteins for subsequent use. Examples include the preparation of commercial products such as enzymes (e.g. lactase), nutritional proteins (e.g. soy protein isolate), and certain biopharmaceuticals (e.g. insulin). Analytical purification produces a relatively small amount of protein for a variety of research or analytical purposes, including identification, quantification, and studies of the protein’s structure, post-translational modifications and function. Among the first purified proteins were urease and Concanavalin A.
2. Strategies
Choice of a starting material is key to the design of a purification process. In a plant or animal, a particular protein usually isn’t distributed homogeneously throughout the body; different organs or tissues have higher or lower concentrations of the protein. Use of only the tissues or organs with the highest concentration decreases the volumes needed to produce a given amount of purified protein. If the protein is present in low abundance, or if it has a high value, scientists may use recombinant DNA technology to develop cells that will produce large quantities of the desired protein (this is known as an expression system). Recombinant expression allows the protein to be tagged, e.g. by a His-tag, to facilitate purification, which means that the purification can be done in fewer steps. In addition to this recombinant expression usually starts with a higher fraction of the desired protein than is present in a natural source.
An analytical purification generally utilizes three properties to separate proteins. First, proteins may be purified according to their isolectric points by running them through a pH graded gel or an ion exchange column. Second, proteins can be separated according to their size or molecular weight via size exclusion chromatography or by SDS-PAGE (sodium dodecyl sulfate-polyacrylamide gel electrophoresis) analysis. Proteins are often purified by using 2D-PAGE and are then analysed by peptide mass fingerprinting to establish the protein identity. This is very useful for scientific purposes and the detection limits for protein are nowadays very low and nanogram amounts of protein are sufficient for their analysis.
3. Evaluating purification yield
The most general method to monitor the purification process is by running a SDS-PAGE of the different steps. This method only gives a rough measure of the amounts of different proteins in the mixture, and it is not able to distinguish between proteins with similar molecular weight.
If the protein has a distinguishing spectroscopic feature or an enzymatic activity, this property can be used to detect and quantify the specific protein, and thus to select the fractions of the separation, that contains the protein. If antibodies against the protein are available then western blotting and ELISA can specifically detect and quantify the amount of desired protein. Some proteins function as receptors and can be detected during purification steps by a ligand binding assay, often using a radioactive ligand.
In order to evaluate the process of multistep purification, the amount of the specific protein have to be compared to the amount of total protein. The latter can be determined by the Bradford total protein assay or by absorbance of light at 280 nm, however some reagents used during the purification process may interfere with the quantification. For example, imidazole (commonly used for purification of polyhistidine-tagged recombinant proteins) is an amino acid analogue and at low concentrations will interfere with the bicinchoninic acid (BCA) assay for total protein quantification. Impurities in low-grade imidazole will also absorb at 280 nm, resulting in an inaccurate reading of protein concentration from UV absorbance.
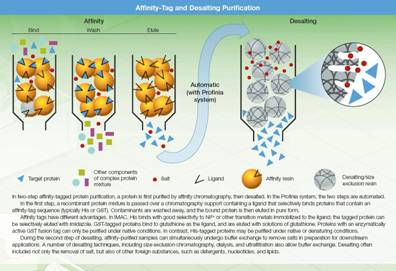
4. Purification of a tagged protein
Adding a tag to the protein such as RuBPS gives the protein a binding affinity it would not otherwise have. Usually the recombinant protein is the only protein in the mixture with this affinity, which aids in separation. The most common tag is the Histidine-tag (His-tag), that has affinity towards nickel or cobalt ions. Thus by immobilizing nickel or cobalt ions on a resin, an affinity support that specifically binds to histidine-tagged proteins can be created. Since the protein is the only component with a His-tag, all other proteins will pass through the column, and leave the His-tagged protein bound to the resin. The protein is released from the column in a process called elution, which in this case involves adding imidazole, to compete with the His-tags for nickel binding, as it has a ring structure similar to histidine. The protein of interest is now the only protein component in the eluted mixture, and can easily be separated from any minor unwanted contaminants by a second step of purification, such as size exclusion chromatography or RP-HPLC.
Another way to tag proteins is to add an antigen peptide to the protein, and then purify the protein on a column containing immobilized antibody. This generates a very specific interaction usually only binding the desired protein.
When the tags are not needed anymore, they can be cleaved off by a protease. This often involves engineering a protease cleavage site between the tag and the protein.
5. Methods of protein purification
The methods used in protein purification, can roughly be divided into analytical and preparative methods. The distinction is not exact, but the deciding factor is the amount of protein, that can practically be purified with that method. Analytical methods aim to detect and identify a protein in a mixture, where as preparative methods aim to produce large quantities of the protein for other purposes, such as structural biology or industrial use. In general, the preparative methods can be used in analytical applications, but not the other way around.
6. Extraction
Depending on the source, the protein has to be brought into solution by breaking the tissue or cells containing it. There are several methods to achieve this: Repeated freezing and thawing, sonication, homogenization by high pressure or permeabilization by organic solvents. The method of choice depends on how fragile the protein is and how sturdy the cells are. After this extraction process soluble proteins will be in the solvent, and can be separated from cell membranes, DNA etc. by centrifugation. The extraction process also extracts proteases, which will start digesting the proteins in the solution. If the protein is sensitive to proteolysis, it is usually desirable to proceed quickly, and keep the extract cooled, to slow down proteolysis.
7. Precipitation and differential solubilization
In bulk protein purification, a common first step to isolate proteins is precipitation with ammonium sulfate (NH4)2SO4. This is performed by adding increasing amounts of ammonium sulfate and collecting the different fractions of precipitate protein. One advantage of this method is that it can be performed inexpensively with very large volumes.
The first proteins to be purified are water-soluble proteins. Purification of integral membrane proteins requires disruption of the cell membrane in order to isolate any one particular protein from others that are in the same membrane compartment. Sometimes a particular membrane fraction can be isolated first, such as isolating mitochondria from cells before purifying a protein located in a mitochondrial membrane. A detergent such as sodium dodecyl sulfate (SDS) can be used to dissolve cell membranes and keep membrane proteins in solution during purification; however, because SDS causes denaturation, milder detergents such as Triton X-100 or CHAPS can be used to retain the protein’s native conformation during purification.
8. Ultracentrifugation
Centrifugation is a process that uses centrifugal force to separate mixtures of particles of varying masses or densities suspended in a liquid. When a vessel (typically a tube or bottle) containing a mixture of proteins or other particulate matter, such as bacterial cells, is rotated at high speeds, the angular momentum yields an outward force to each particle that is proportional to its mass. The tendency of a given particle to move through the liquid because of this force is offset by the resistance the liquid exerts on the particle. The net effect of “spinning” the sample in a centrifuge is that massive, small, and dense particles move outward faster than less massive particles or particles with more “drag” in the liquid. When suspensions of particles are “spun” in a centrifuge, a “pellet” may form at the bottom of the vessel that is enriched for the most massive particles with low drag in the liquid. The remaining, non-compacted particles still remaining mostly in the liquid are called the “supernatant” and can be removed from the vessel to separate the supernatant from the pellet. The rate of centrifugation is specified by the angular acceleration applied to the sample, typically measured in comparison to the g. If samples are centrifuged long enough, the particles in the vessel will reach equilibrium wherein the particles accumulate specifically at a point in the vessel where where their buoyant density is balanced with centrifugal force. Such an “equilibrium” centrifugation can allow extensive purification of a given particle.
Sucrose gradient centrifugation — a linear concentration gradient of sugar (typically sucrose, glycerol, or a silica based density gradient media, like Percoll) is generated in a tube such that the highest concentration is on the bottom and lowest on top. Percoll is a trademark owned by GE Healthcare companies. A protein sample is then layered on top of the gradient and spun at high speeds in an ultracentrifuge. This causes heavy macromolecules to migrate towards the bottom of the tube faster than lighter material. During centrifugation in the absence of sucrose, as particles move farther and farther from the center of rotation, they experience more and more centrifugal force (the further they move, the faster they move). The problem with this is that the useful separation range of within the vessel is restricted to a small observable window. Spinning a sample twice as long doesn’t mean the particle of interest will go twice as far, in fact, it will go significantly further. However, when the proteins are moving through a sucrose gradient, they encounter liquid of increasing density and viscosity. A properly designed sucrose gradient will counteract the increasing centrifugal force so the particles move in close proportion to the time they have been in the centrifugal field. Samples separated by these gradients are referred to as “rate zonal” centrifugations. After separating the protein/particles, the gradient is then fractionated and collected.
9. Chromatographic methods
Usually a protein purification protocol contains one or more chromatographic steps. The basic procedure in chromatography is to flow the solution containing the protein through a column packed with various materials. Different proteins interact differently with the column material, and can thus be separated by the time required to pass the column, or the conditions required to elute the protein from the column. Usually proteins are detected as they are coming off the column by their absorbance at 280 nm. Many different chromatographic methods exist:
9.1. Size exclusion chromatography
Chromatography can be used to separate protein in solution or denaturing conditions by using porous gels. This technique is known as size exclusion chromatography. The principle is that smaller molecules have to traverse a larger volume in a porous matrix. Consequentially, proteins of a certain range in size will require a variable volume of eluant (solvent) before being collected at the other end of the column of gel.
In the context of protein purification, the eluant is usually pooled in different test tubes. All test tubes containing no measurable trace of the protein to purify are discarded. The remaining solution is thus made of the protein to purify and any other similarly-sized proteins.
9.2. Separation based on charge or hydrophobicity
9.3. Ion exchange chromatography
Ion exchange chromatography separates compounds according to the nature and degree of their ionic charge. The column to be used is selected according to its type and strength of charge. Anion exchange resins have a positive charge and are used to retain and separate negatively charged compounds, while cation exchange resins have a negative charge and are used to separate positively charged molecules.
Before the separation begins a buffer is pumped through the column to equilibrate the opposing charged ions. Upon injection of the sample, solute molecules will exchange with the buffer ions as each competes for the binding sites on the resin. The length of retention for each solute depends upon the strength of its charge. The most weakly charged compounds will elute first, followed by those with successively stronger charges. Becauses of the nature of the separating mechanism, pH, buffer type, buffer concentration, and temperature all play important roles in controlling the separation.
Ion exchange chromatography is a very powerful tool for use in protein purification and is frequently used in both analytical and preparative separations.
9.4. Affinity chromatography
Affinity Chromatography is a separation technique based upon molecular conformation, which frequently utilizes application specific resins. These resins have ligands attached to their surfaces which are specific for the compounds to be separated. Most frequently, these ligands function in a fashion similar to that of antibody-antigen interactions. This “lock and key” fit between the ligand and its target compound makes it highly specific, frequently generating a single peak, while all else in the sample is unretained.
A simple column for Ni2+-affinity chromatography.
The sample and subsequent buffers are manually poured into the column.
Many membrane proteins are glycoproteins and can be purified by lectin affinity chromatography. Detergent-solubilized proteins can be allowed to bind to a chromatography resin that has been modified to have a covalently attached lectin. Proteins that do not bind to the lectin are washed away and then specifically bound glycoproteins can be eluted by adding a high concentration of a sugar that competes with the bound glycoproteins at the lectin binding site. Some lectins have high affinity binding to oligosaccharides of glycoproteins that is hard to compete with sugars, and bound glycoproteins need to be released by denaturing the lectin.
9.4.1. Metal binding
A common technique involves engineering a sequence of 6 to 8 histidines into the C-terminal of the protein. The polyhistidine binds strongly to divalent metal ions such as nickel and cobalt. The protein can be passed through a column containing immobilized nickel ions, which binds the polyhistidine tag. All untagged proteins pass through the column. The protein can be eluted with imidazole, which competes with the polyhistidine tag for binding to the column, or by a decrease in pH (typically to 4.5), which decreases the affinity of the tag for the resin. While this procedure is generally used for the purification of recombinant proteins with an engineered affinity tag (such as a 6xHis tag or Clontech’s HAT tag), it can also be used for natural proteins with an inherent affinity for divalent cations.
9.4.2. Immunoaffinity chromatography
Immunoaffinity chromatography uses the specific binding of an antibody to the target protein to selectively purify the protein. The procedure involves immobilizing an antibody to a column material, which then selectively binds the protein, while everything else flows through. The protein can be eluted by changing the pH or the salinity. Because this method does not involve engineering in a tag, it can be used for proteins from natural sources.[1]
9.5. HPLC
High performance liquid chromatography or high pressure liquid chromatography is a form of chromatography applying high pressure to drive the solutes through the column faster. This means that the diffusion is limited and the resolution is improved. The most common form is “reversed phase” hplc, where the column material is hydrophobic. The proteins are eluted by a gradient of increasing amounts of an organic solvent, such as acetonitrile. The proteins elute according to their hydrophobicity. After purification by HPLC the protein is in a solution that only contains volatile compounds, and can easily be lyophilized.[2] HPLC purification frequently results in denaturation of the purified proteins and is thus not applicable to proteins that do not spontaneously refold.
10. Concentration of the purified protein
At the end of a protein purification, the protein often has to be concentrated. Different methods exist.
10.1. Lyophilization
If the solution doesn’t contain any other soluble component than the protein in question the protein can be lyophilized (dried). This is commonly done after a HPLC run. This simply removes all volatile component leaving the proteins behind.
10.2. Ultrafiltration
Ultrafiltration concentrates a protein solution using selective permeable membranes. The function of the membrane is to let the water and small molecules pass through while retaining the protein. The solution is forced against the membrane by mechanical pump or gas pressure or centrifugation.
11. Analytical
11.1 Denaturing-Condition Electrophoresis
Gel electrophoresis is a common laboratory technique that can be use both as preparative and analytical method. The principle of electrophoresis relies on the movement of a charged ion in an electric field. In practice, the proteins are denatured in a solution containing a detergent (SDS). In these conditions, the proteins are unfolded and coated with negatively charged detergent molecules. The proteins in SDS-PAGE are separated on the sole basis of their size.
In analytical methods, the protein migrate as bands based on size. Each band can be detected using stains such as Coomassie blue dye or silver stain. Preparative methods to purify large amounts of protein, require the extraction of the protein from the electrophoretic gel. This extraction may involve excision of the gel containing a band, or eluting the band directly off the gel as it runs off the end of the gel.
In the context of a purification strategy, denaturing condition electrophoresis provides an improved resolution over size exclusion chromatography, but does not scale to large quantity of proteins in a sample as well as the late chromatography columns.
11.2. Non-Denaturing-Condition Electrophoresis
An important non-denaturing electrophoretic procedure for isolating bioactive metalloproteins in complex protein mixtures is termed ‘quantitative native continuous polyacrylamide gel electrophoresis (QPNC-PAGE).
12. References
1. Immunoaffinity chromatography of enzymes Ehle H, Horn A. Bioseparation. 1990;1(2):97-110.
2. High-performance liquid chromatography of biopolymers Regnier FE Science. 1983 Oct 21;222(4621):245-52
13. External links
Protein sequencing
Proteins are found in every cell and are essential to every biological process, protein structure is very complex: determining a protein’s structure involves first protein sequencing – determining the amino acid sequences of its constituent peptides; and also determining what conformation it adopts and whether it is complexed with any non-peptide molecules. Discovering the structures and functions of proteins in living organisms is an important tool for understanding cellular processes, and allows drugs that target specific metabolic pathways to be invented more easily.
The two major direct methods of protein sequencing are mass spectrometry and the Edman degradation reaction. It is also possible to generate an amino acid sequence from the DNA or mRNA sequence encoding the protein, if this is known. However, there are a number of other reactions which can be used to gain more limited information about protein sequences and can be used as preliminaries to the aforementioned methods of sequencing or to overcome specific inadequacies within them.
Contents
1. Determining amino acid composition
1.1. Hydrolysis
1.2. Separation
1.3. Quantitative analysis
2. N-terminal amino acid analysis
3. C-terminal amino acid analysis
4. Edman degradation
5. The Edman degradation reaction
5.1. Limitations of the Edman degradation
6. Mass spectroscopy
7. Predicting protein sequence from DNA/RNA sequences
8. References
1. Determining amino acid composition
It is often desirable to know the unordered amino acid composition of a protein prior to attempting to find the ordered sequence, as this knowledge can be used to facilitate the discovery of errors in the sequencing process or to distinguish between ambiguous results. Knowledge of the frequency of certain amino acids may also be used to choose which protease to use for digestion of the protein. A generalised method for doing this is as follows:
(1). Hydrolyse a known quantity of protein into its constituent amino acids.
(2). Separate the amino acids in some way.
(3). Determine the respective quantities of the amino acids.
1.1. Hydrolysis
Hydrolysis is done by heating a sample of the protein in 6 Molar hydrochloric acid to 100-110 degrees Celsius for 24 hours or longer. Proteins with many bulky hydrophobic groups may require longer heating periods. However, these conditions are so vigorous that some amino acids (serine, threonine, tyrosine, tryptophan, glutamine and cystine) are degraded. To circumvent this problem, Biochemistry Online suggests heating separate samples for different times, analysing each resulting solution, and extrapolating back to zero hydrolysis time. Rastall suggests a variety of reagents to prevent or reduce degradation – thiol reagents or phenol to protect tryptophan and tyrosine from attack by chlorine, and pre-oxidising cysteine. He also suggests measuring the quantity of ammonia evolved to determine the extent of amide hydrolysis.
1.2. Separation
The amino acids can be separated by Ion-exchange chromatography or hydrophobic interaction chromatography. An example of the former is given by the NTRC using sulfonated polystyrene as a matrix, adding the amino acids in acid solution and passing a buffer of steadily increasing pH through the column. Amino acids will be eluted when the pH reaches their respective isoelectric points. The latter technique may be employed through the use of reversed phase chromatography. Many commercially available C8 and C18 silica columns have demonstrated successful separation of amino acids in solution in less than 40 minutes through the use of an optimised elution gradient.
1.3. Quantitative analysis
Once the amino acids have been separated, their respective quantities are determined by adding a reagent that will form a coloured derivative. If the amounts of amino acids are in excess of 10 nmol, ninhydrin can be used for this – it gives a yellow colour when reacted with proline, and a vivid blue with other amino acids. The concentration of amino acid is proportional to the absorbance of the resulting solution. With very small quantities, down to 10 pmol, fluorescamine can be used as a marker: this forms a fluorescent derivative on reacting with an amino acid.
2. N-terminal amino acid analysis
Determining which amino acid forms the N-terminus of a peptide chain is useful for two reasons: to aid the ordering of individual peptide fragments’ sequences into a whole chain, and because the first round of Edman degradation is often contaminated by impurities and therefore does not give an accurate determination of the N-terminal amino acid. A generalised method for N-terminal amino acid analysis follows:
(1). React the peptide with a reagent which will selectively label the terminal amino acid.
(2). Hydrolyse the protein.
(3). Determine the amino acid by chromatography and comparison with standards.
There are many different reagents which can be used to label terminal amino acids. They all react with amine groups and will therefore also bind to amine groups in the side chains of amino acids such as lysine – for this reason it is necessary to be careful in interpreting chromatograms to ensure that the right spot is chosen. Two of the more common reagents are Sanger’s reagent (2,4-dinitrofluorobenzene) and dansyl derivatives such as dansyl chloride. Phenylisothiocyanate, the reagent for the Edman degradation, can also be used. The same questions apply here as in the determination of amino acid composition, with the exception that no stain is needed, as the reagents produce coloured derivatives and only qualitative analysis is required, so the amino acid does not have to be eluted from the chromatography column, just compared with a standard. Another consideration to take into account is that, since any amine groups will have reacted with the labelling reagent, ion exchange chromatography cannot be used, and thin layer chromatography or high pressure liquid chromatography should be used instead.
3. C-terminal amino acid analysis
The number of methods available for C-terminal amino acid analysis is much smaller than the number of available methods of N-terminal analysis. The most common method is to add carboxypeptidases to a solution of the protein, take samples at regular intervals, and determine the terminal amino acid by analysing a plot of amino acid concentrations against time.
4. Edman degradation
The Edman degradation is a very important reaction for protein sequencing, because it allows the ordered amino acid composition of a protein to be discovered. Automated Edman sequencers are now in widespread use, and are able to sequence peptides up to approximately 50 amino acids long. A reaction scheme for sequencing a protein by the Edman degradation follows – some of the steps are elaborated on subsequently.
(1). Break any disulfide bridges in the protein by oxidising with performic acid.
(2). Separate and purify the individual chains of the protein complex, if there are more than one.
(3). Determine the amino acid composition of each chain.
(4). Determine the terminal amino acids of each chain.
(5). Break each chain into fragments under 50 amino acids long.
(6). Separate and purify the fragments.
(7). Determine the sequence of each fragment.
(8). Repeat with a different pattern of cleavage.
(9). Construct the sequence of the overall protein.
Digestion into peptide fragments Peptides longer than about 50-70 amino acids long cannot be sequenced reliably by the Edman degradation. Because of this, long protein chains need to be broken up into small fragments which can then be sequenced individually. Digestion is done either by endopeptidases such as trypsin or pepsin or by chemical reagents such as cyanogen bromide. Different enzymes give different cleavage patterns, and the overlap between fragments can be used to construct an overall sequence.
5. The Edman degradation reaction
The peptide to be sequenced is adsorbed onto a solid surface – one common substrate is glass fibre coated with polybrene, a cationic polymer. The Edman reagent, phenylisothiocyanate (PTC), is added to the adsorbed peptide, together with a mildly basic buffer solution of 12% trimethylamine. This reacts with the amine group of the N-terminal amino acid.
The terminal amino acid derivative can then be selectively detached by the addition of anhydrous acid. The derivative then isomerises to give a substituted phenylthiohydantoin which can be washed off and identified by chromatography, and the cycle can be repeated. The efficiency of each step is about 98%, which allows about 50 amino acids to be reliably determined.
5.1. Limitations of the Edman degradation
Because the Edman degradation proceeds from the N-terminus of the protein, it will not work if the N-terminal amino acid has been chemically modified or if it is concealed within the body of the protein. It also requires the use of either guesswork or a separate procedure to determine the positions of disulfide bridges.
6. Mass spectroscopy
The other major direct method by which the sequence of a protein can be determined is mass spectrometry. This method has been gaining popularity in recent years as new techniques and increasing computing power have facilitated it. Mass spectrometry can, in principle, sequence any size of protein, but the problem becomes computationally more difficult as the size increases. Peptides are also easier to prepare for mass spectrometry than whole proteins, because they are more soluble. One method of delivering the peptides to the spectrometer is electrospray ionization, which won the Nobel Prize in chemistry in 2002. The protein is digested by an endoprotease, and the resulting solution is passed through a high pressure liquid chromatography column. At the end of this column, the solution is sprayed out of a narrow nozzle charged to a high positive potential into the mass spectrometer. The charge on the droplets causes them to fragment until only single ions remain. The peptides are then fragmented and the mass-charge ratios of the fragments measured. (It is possible to detect which peaks correspond to multiply charged fragments, because these will have auxiliary peaks corresponding to other isotopes – the distance between these other peaks is inversely proportional to the charge on the fragment). The mass spectrum is analysed by computer and often compared against a database of previously sequenced proteins in order to determine the sequences of the fragments. This process is then repeated with a different digestion enzyme, and the overlaps in the sequences used to construct a sequence for the protein.
7. Predicting protein sequence from DNA/RNA sequences
The amino acid sequence of a protein can also be determined indirectly from the mRNA or, in organisms that do not have introns (e.g. prokaryotes), the DNA that codes for the protein. If the sequence of the gene is already known, then this is all very easy. However, it is rare that the DNA sequence of a newly isolated protein will be known, and so if this method is to be used, it has to be found in some way. One way that this can be done is to sequence a short section, perhaps 15 amino acids long, of the protein by one of the above methods, and then use this sequence to generate a complementary marker for the protein’s RNA. This can then be used to isolate the mRNA coding for the protein, which can then be replicated in a polymerase chain reaction to yield a significant amount of DNA, which can then be sequenced relatively easily. The amino acid sequence of the protein can then be deduced from this. However, it is necessary to take into account the possibility of amino acids being removed after the mRNA has been translated.
8. References
• Amino acid composition and protein sequencing.
• Henry Jakubowski. Biochemistry Online, chapter 2 B.
• Hanno Steen & Matthias Mann. The abc’s (and xyz’s) of peptide sequencing. Nature Reviews Molecular Cell Biology, 5:699-711, 2004.
• Sergio Marchesini Michael W. King. Analysis of protein.
• R A Rastall. Investigating protein structure and function.
• Alberts Bray Johnson Lewis Raff Roberts & Walter. 1998. Essential Cell Biology: An Introduction to the Molecular Biology of the Cell. Garland Publishing, New York.
Protein mass spectrometry
Protein mass spectrometry refers to the application of mass spectrometry to the study of proteins. Mass spectrometry is an important emerging method for the characterization of proteins. The two primary methods for ionization of whole proteins are electrospray ionization (ESI) and matrix-assisted laser desorption/ionization (MALDI). In keeping with the performance and mass range of available mass spectrometers, two approaches are used for characterizing proteins. In the first, intact proteins are ionized by either of the two techniques described above, and then introduced to a mass analyser. This approach is referred to as “top-down” strategy of protein analysis. In the second, proteins are enzymatically digested into smaller peptides using an agent such as trypsin or pepsin. Other proteolytic agents are also used. The collection of peptide products are then introduced to the mass analyzer. This peptide mass fingerprinting (PMF) approach of protein analysis is also referred to as the “bottom-up” approach.
Whole protein mass analysis is primarily conducted using either time-of-flight (TOF) MS, or Fourier transform ion cyclotron resonance (FT-ICR). These two types of instrument are preferable here because of their wide mass range, and in the case of FT-ICR, its high mass accuracy. Mass analysis of proteolytic peptides is a much more popular method of protein characterization, as cheaper instrument designs can be used for characterization. Additionally, sample preparation is easier once whole proteins have been digested into smaller peptide fragments. The most widely used instrument for peptide mass analysis are the MALDI time-of-flight instruments as they permit the acquisition of PMFs at high pace (1 PMF can be analysed in approx. 10 sec). Multiple stage quadrupole-time-of-flight and the quadrupole ion trap also find use in this application.
1. Protein and peptide fractionation coupled with mass spectrometry
Proteins of interest to biological researchers are usually part of a very complex mixture of other proteins and molecules that co-exist in the biological medium. This presents two significant problems. First, the two ionization techniques used for large molecules only work well when the mixture contains roughly equal amounts of constituents, while in biological samples, different proteins tend to be present in widely differing amounts. If such a mixture is ionized using electrospray or MALDI, the more abundant species have a tendency to “drown” or suppress signals from less abundant ones. The second problem is that the mass spectrum from a complex mixture is very difficult to interpret because of the overwhelming number of mixture components. This is exacerbated by the fact that enzymatic digestion of a protein gives rise to a large number of peptide products.
To contend with this problem, two methods are widely used to fractionate proteins, or their peptide products from an enzymatic digestion. The first method fractionates whole proteins and is called two-dimensional gel electrophoresis. The second method, high performance liquid chromatography is used to fractionate peptides after enzymatic digestion. In some situations, it may be necessary to combine both of these techniques.
Gel spots identified on a 2D Gel are usually attributable to one protein. If the identity of the protein is desired, the gel spot can be excised, and digested proteolytically. The peptide masses resulting from the digestion can be determined by mass spectrometry using peptide mass fingerprinting. If this information does not allow unequivocal identification of the protein, its peptides can be subject to tandem mass spectrometry.
Characterization of protein mixtures using HPLC/MS is also called shotgun proteomics and mudpit. A peptide mixture that results from digestion of a protein mixture is fractionated by one or two steps of liquid chromatography. The eluent from the chromatography stage can be either directly introduced to the mass spectrometer through electrospray ionization, or laid down on a series of small spots for later mass analysis using MALDI.
2. Protein identification
There are two main ways MS is used to identify proteins. Peptide mass fingerprinting (mentioned in the previous section) uses the masses of proteolytic peptides as input to a search of a database of predicted masses that would arise from digestion of a list of known proteins. If a protein sequence in the reference list gives rise to a significant number of predicted masses that match the experimental values, there is some evidence that this protein was present in the original sample.
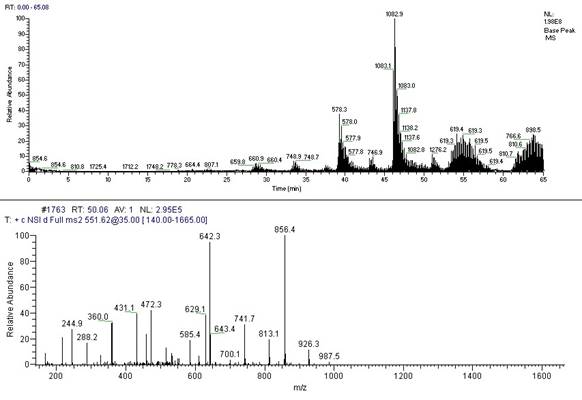
Full MS and MS2 spectra of a peptide.
Tandem MS is becoming a more popular experimental method for identifying proteins. Collision-induced dissociation is used in mainstream applications to generate a set of fragments from a specific peptide ion. The fragmentation process primarily gives rise to cleavage products that break along peptide bonds. Because of this simplicity in fragmentation, it is possible to use the observed fragment masses to match with a database of predicted masses for one of many given peptide sequences. Tandem MS of whole protein ions has been investigated recently using electron capture dissociation and has demonstrated extensive sequence information in principle but is not in common practice. This is sometimes referred to as the “top-down” approach in that it involves starting with the whole mass and then pulling it apart rather than starting with pieces (proteolytic fragments) and piecing the protein back together using De novo repeat detection (bottom-up).
A number of different algorithmic approaches have been described to identify peptides and proteins from tandem mass spectrometry (MS/MS), peptide de novo sequencing and sequence tag based searching.
Other existing mass spec analysis software include: For PMF searches refer to:Peptide mass fingerprinting
For protein identification through peptide fragment fingerprinting (MS/MS) see these web resources : Mascot OMSSA PeptideSearch X!Tandem
Peptide de novo sequencing: LuteFisk PepNovo Sherenga
Peptide sequence tag based searching: SPIDER InsPecT Mascot GutenTAG [1]
3. Protein quantitation
Several recent methods allow for the quantitation of proteins by mass spectrometry. Typically, stable (e.g. non-radioactive) heavier isotopes of carbon (13C) or nitrogen (15N) are incorporated into one sample while the other one is labeled with corresponding light isotopes (e.g. 12C and 14N). The two samples are mixed before the analysis. Peptides derived from the different samples can be distinguished due to their mass difference. The ratio of their peak intensities corresponds to the relative abundance ratio of the peptides (and proteins). The most popular methods for isotope labeling are SILAC (stable isotope labellings with amino acids in cell culture), trypsin-catalyzed 18O labeling, ICAT (isotope coded affinity tagging), ITRAQ (isotope tags for relative and absolute quantitation).[2] “Semi-quantitative” mass spectrometry can be performed without labeling of samples. Typically, this is done with MALDI analysis (in linear mode). The peak intensity, or the peak area, from individual molecules (typically proteins) is here correlated to the amount of protein in the sample. However, the individual signal depends on the primary structure of the protein, on the complexity of the sample, and on the settings of the instrument. Other types of “label-free” quantitative mass spectrometry, uses the spectral counts (or peptide counts) of digested proteins as a means for determining relative protein amounts.
4. Protein structure
Characteristics indicative of the 3 dimensional structure of proteins can be probed with mass spectrometry in various ways.[3] By using chemical crosslinking to couple parts of the protein that are close in space, but far apart in sequence, information about the overall structure can be inferred. By following the exchange of amide protons with deuterium from the solvent, it is possible to probe the solvent accessibility of various parts of the protein. [4]
5. References
1. P. Hernandez, M. Müller and R. D. Appel (2006). “Automated protein identification by tandem mass spectrometry: Issues and strategies”. Mass Spectrometry Reviews 25 (2): 235-254.
2. M. Miyagi and K. C. S. Rao (2007). “Proteolytic 18O-labeling strategies for quantitative proteomics”. Mass Spectrometry Reviews 26 (1): 121-136.
3. Z. Zhang, D. L. Smith (1994). “Probing noncovalent structural features of proteins by mass spectrometry”. Mass Spectrometry Reviews 13 (5-6): 411-429.
4. T. E. Wales and J. R. Engen (2006). “Hydrogen exchange mass spectrometry for the analysis of protein dynamics”. Mass Spectrometry Reviews 25 (1): 158-170.
Proteomics
Proteomics is the large-scale study of proteins, particularly their structures and functions. Proteins are vital parts of living organisms, as they are the main components of the physiological pathways of cells. The term “proteomics” was coined to make an analogy with genomics, the study of the genes. The word “proteome” is a portmanteau of “protein” and “genome”. The proteome of an organism is the set of proteins produced by it during its life, and its genome is its set of genes.
Proteomics is often considered the next step in the study of biological systems, after genomics. It is much more complicated than genomics, mostly because while an organism’s genome is rather constant, a proteome differs from cell to cell and constantly changes through its biochemical interactions with the genome and the environment. One organism has radically different protein expression in different parts of its body, different stages of its life cycle and different environmental conditions. Another major difficulty is the complexity of proteins relative to nucleic acids. E.g., in human there are about 25 000 identified genes but an estimated >500 000 proteins that are derived from these genes. This increased complexity derives from mechanisms such as alternative splicing, protein modification (glycosylation,phosphorylation) and protein degradation.
Scientists are very interested in proteomics because it gives a much better understanding of an organism than genomics. First, the level of transcription of a gene gives only a rough estimate of its level of expression into a protein. An mRNA produced in abundance may be degraded rapidly or translated inefficiently, resulting in a small amount of protein. Second, many proteins experience post-translational modifications that profoundly affect their activities; for example some proteins are not active until they become phosphorylated. Methods such as phosphoproteomics and glycoproteomics are used to study post-translational modifications. Third, many transcripts give rise to more than one protein, through alternative splicing or alternative post-translational modifications. Finally, many proteins form complexes with other proteins or RNA molecules, and only function in the presence of these other molecules.
Since proteins play a central role in the life of an organism, proteomics is instrumental in discovery of biomarkers, such as markers that indicate a particular disease.
With the completion of a rough draft of the human genome, many researchers are looking at how genes and proteins interact to form other proteins. A surprising finding of the Human Genome Project is that there are far fewer protein-coding genes in the human genome than proteins in the human proteome (20,000 to 25,000 genes vs. > 500,000 proteins). The human body may even contain more than 2 million proteins, each having different functions. The protein diversity is thought to be due to alternative splicing and post-translational modification of proteins. The discrepancy implies that protein diversity cannot be fully characterized by gene expression analysis, thus proteomics is useful for characterizing cells and tissues.
To catalog all human proteins, their functions and interactions is a great challenge for scientists. An international collaboration with these goals is co-ordinated by the Human Proteome Organization (HUPO).
Contents
1. Studying proteomics
2. Biomarkers
3. Branches
4. Technologies
5. References
1. Studying proteomics
Most proteins function in collaboration with other proteins, and one goal of proteomics is to identify which proteins interact. This often gives important clues about the functions of newly discovered proteins. Several methods are available to probe protein-protein interactions. The traditional method is yeast two-hybrid analysis. New methods include protein microarrays, immunoaffinity chromatography followed by mass spectrometry, and combinations of experimental methods such as phage display and computational methods.
Current research in proteomics requires first that proteins be resolved, sometimes on a massive scale. Protein separation can be performed using two-dimensional gel electrophoresis, which usually separates proteins first by isoelectric point and then by molecular weight. Protein spots in a gel can be visualized using a variety of chemical stains or fluorescent markers. Proteins can often be quantified by the intensity of their stain. Once proteins are separated and quantified, they are identified. Individual spots are cut out of the gel and cleaved into peptides with proteolytic enzymes. These peptides can then be identified by mass spectrometry, specifically matrix-assisted laser desorption-ionization time-of-flight (MALDI-TOF) mass spectrometry. In this procedure, a peptide is placed on a matrix, which causes the peptide to form crystals[citation needed]. Then the peptide on the matrix is ionized with a laser beam and an increase in voltage at the matrix is used to shoot the ions toward a detector in which the time it takes an ion to reach the detector depends on its mass. The higher the mass, the longer the time of flight of the ion. In a MALDI-TOF mass spectrometer, the ions can also be deflected with an electrostatic reflector that also focuses the ion beam. Thus, the masses of the ions reaching the second detector can be determined with high precision and these masses can reveal the exact chemical compositions of the peptides, and therefore their identities.
Protein mixtures can also be analyzed without prior separation. These procedures begin with proteolytic digestion of the proteins in a complex mixture. The resulting peptides are often injected onto a high pressure liquid chromatography column (HPLC) that separates peptides based on hydrophobicity. HPLC can be coupled directly to a time-of-flight mass spectrometer using electrospray ionization. Peptides eluting from the column can be identified by tandem mass spectrometry (MS/MS). The first stage of tandem MS/MS isolates individual peptide ions, and the second breaks the peptides into fragments and uses the fragmentation pattern to determine their amino acid sequences. Labeling with isotope tags can be used to quantitatively compare proteins concentration among two or more protein samples.
One of the most promising developments to come from the study of human genes and proteins has been the identification of potential new drugs for the treatment of disease. This relies on genome and proteome information to identify proteins associated with a disease, which computer software can then use as targets for new drugs. For example, if a certain protein is implicated in a disease, its 3D structure provides the information to design drugs to interfere with the action of the protein. A molecule that fits the active site of an enzyme, but cannot be released by the enzyme, will inactivate the enzyme. This is the basis of new drug-discovery tools, which aim to find new drugs to inactivate proteins involved in disease. As genetic differences among individuals are found, researchers expect to use these techniques to develop personalized drugs that are more effective for the individual.
A computer technique which attempts to fit millions of small molecules to the three-dimensional structure of a protein is called “virtual ligand screening”. The computer rates the quality of the fit to various sites in the protein, with the goal of either enhancing or disabling the function of the protein, depending on its function in the cell. A good example of this is the identification of new drugs to target and inactivate the HIV-1 protease. The HIV-1 protease is an enzyme that cleaves a very large HIV protein into smaller, functional proteins. The virus cannot survive without this enzyme; therefore, it is one of the most effective protein targets for killing HIV.
There are many distributed computing programs, such as the world community grid, which allows people around the world to help scientists by computing calculations. The software adds to the use of super computers by using the unused processing power of millions of home computers. The world community grid works on HIV, cancer, and protein folding. All three projects centre around protein modelling and protein modification models. Using the data gained from distributed computing models of proteins, scientists can develop more specific and effective therapies. In addition, most enzymes act as part of complexes and networks, which also affect the way an enzyme acts in a cell. Understanding these complex networks will assist in developing drugs that affect the function of these complexes.
2. Biomarkers
Understanding the proteome, the structure and function of each protein and the complexities of protein-protein interactions will be critical for developing the most effective diagnostic techniques and disease treatments in the future.
An interesting use of proteomics is using specific protein biomarkers to diagnose disease. A number of techniques allow to test for proteins produced during a particular disease, which helps to diagnose the disease quickly. Techniques include western blot, immunohistochemical staining, enzyme linked immunosorbent assay (ELISA) or mass spectrometry. The following are some of the diseases that have characteristic biomarkers that physicians can use for diagnosis:
• In Alzheimer’s disease, elevations in beta secretase creates amyloid/beta-protein, which causes plaque to build up in the patient’s brain, which causes dementia. Targeting this enzyme decreases the amyloid/beta-protein and so slows the progression of the disease. A procedure to test for the increase in amyloid/beta-protein is immunohistochemical staining, in which antibodies bind to specific antigens or biological tissue of amyloid/beta-protein.
• Heart disease is commonly assessed using several key protein based biomarkers. Standard protein biomarkers for CVD include interleukin-6, interleukin-8, serum amyloid A protein, fibrinogen, and troponins. cTnI cardiac troponin I increases in concentration within 3 to 12 hours of initial cardiac injury and can be found elevated days after an acute myocardial infarction. A number of commercial antibody based assays as well as other methods are used in hospitals as primary tests for acute MI.
• Proteomic analysis of kidney cells and cancerous kidney cells is producing promising leads for biomarkers for renal cell carcinoma and developing assays to test for this disease. In kidney-related diseases, urine is a potential source for such biomarkers. Recently, it has been shown that the identification of urinary polypeptides as biomarkers of kidney-related diseases allows to diagnose the severity of the disease several months before the appearance of the pathology.Article
3. Branches
• Protein separation. Proteomic technologies rely on the ability to separate a complex mixture so that individual proteins are more easily processed with other techniques.
• Protein identification. Well-known methods include low-throughput sequencing through Edman degradation. Higher-throughput proteomic techniques are based on mass spectrometry, commonly peptide mass fingerprinting on MALDI-TOF instruments, or De novo repeat detection MS/MS on instruments capable of more than one round of mass spectrometry. MS/MS data can be analyzed by simple database searches as is the case for PMFs and additionally they can be analyzed by de novo sequencing and homology searching. This particular approach allows to even identify similar (homolog) proteins, e.g. across species in case a protein was derived from an organism with unsequenced genome. Antibody-based assays can also be used, but are unique to one sequence motif.
• Protein quantification. Gel-based methods are used, including differential staining of gels with fluorescent dyes (difference gel electrophoresis). Gel-free methods include various tagging or chemical modification methods, such as isotope-coded affinity tags (ICATs), metal coded affinity tags (MeCATs) or combined fractional diagonal chromatography (COFRADIC)[1]. In metabolic labeling cells incorporate heavy stable isotopes present in their growth media (e.g. stable isotope labeling with amino acids in cell culture or SILAC). Modern day gel electrophoresis research often leverages software-based image analysis tools primarily to analyze bio-markers by quantifying individual, as well as showing the separation between one or more protein “spots” on a scanned image of a 2-DE product. Additionally, these tools match spots between gels of similar samples to show, for example, proteomic differences between early and advanced stages of an illness.
• Protein sequence analysis is a branch of bioinformatics that deals with searching databases for possible protein or peptide matches by algorithms such as Mascot, PEAKS(software), OMSSA, SEQUEST and X!Tandem, functional assignment of domains, prediction of function from sequence, and evolutionary relationships of proteins.
• Structural proteomics concerns the high-throughput determination of protein structures in three-dimensional space. Common methods are x-ray crystallography and NMR spectroscopy.
• Interaction proteomics concerns the investigation of protein interactions on the atomic, molecular and cellular levels. see related article on Protein-protein interaction prediction.
• Protein modification studies the modified forms of proteins. Almost all proteins are modified from their pure translated amino-acid sequence, by so-called post-translational modification. Specialized methods have been developed to study phosporylation (phosphoproteomics) and glycosylation (glycoproteomics).
• Cellular proteomics is a new branch of proteomics aiming to map the location of proteins and protein-protein interactions in whole cells during key cell events. Centers around the use of techniques such as X-ray Tomography and optical fluorescence microscopy.
• Experimental bioinformatics is a branch of bioinformatics, as it is applied in proteomics, coined by Mathias Mann. It involves the mutual design of experimental and bioinformatics methods to create (extract) new types of information from proteomics experiments.
4. Technologies
Proteomics uses various technologies:
• One- and two-dimensional gel electrophoresis is used to identify the relative mass of a protein and its isoelectric point.
• X-ray crystallography and nuclear magnetic resonance are used to characterize the three-dimensional structure of peptides and proteins. However, low-resolution techniques such as circular dichroism, Fourier transform infrared spectroscopy and Small angle X-ray scattering (SAXS) can be used to study the secondary structure of proteins.
• Tandem mass spectrometry combined with reverse phase chromatography or 2-D electrophoresis is used to identify proteins using database search tools such as Mascot, PEAKS(software), OMSSA, X!Tandem and SEQUEST or de novo algorithms and quantify all the levels of proteins found in cells.
• Scaffold, a software tool useful in visualization of tandem mass spectrometry results.
• Tandem mass spectrometry combined with tagging technologies such as TMT, ICPL or ITRAQ is used for quantifica-tion of proteins and peptides.
• Mass spectrometry (no-tandem), often MALDI-TOF, is used to identify proteins by peptide mass fingerprinting. This technology is also used in so-called “MALDI-TOF MS protein profiling” where samples (i.e. serum) are prepared by either protein chips (SELDI-TOF MS), magnetic beads (The Bruker Daltonics protein profiling platform) or with other methods of sample treatment, such as liquid chromatography, size-exclusion and immunoaffinity. Protein peaks of interest must be identified by tandem mass spectrometry. Protein profiling with MALDI-TOF MS could be of high use in clinical diagnostics, but so far there has been little success with advancing MALDI-TOF MS protein profiling into clinical validation due to high analytical variation.
• Affinity chromatography, yeast two hybrid techniques, fluorescence resonance energy transfer (FRET), and Surface Plasmon Resonance (SPR) are used to identify protein-protein and protein-DNA binding reactions.
• X-ray Tomography used to determine the location of labeled proteins or protein complexes in an intact cell. Frequently correlated with images of cells from light based microscopes.
• Software based image analysis is utilized to automate the quantification and detection of spots within and among gels samples. While this technology is widely utilized, the intelligence has not been perfected yet. For example, the leading software tools in this area tend to agree on the analysis of well-defined, well-separated protein spots, but they deliver different results and tendencies with less-defined less-separated spots – thus necessitating manual verification of results.
5. References
• Belhajjame, K. et al. Proteome Data Integration: Characteristics and Challenges. Proceedings of the UK e-Science All Hands Meeting, ISBN 1-904425-53-4, September 2005, Nottingham, UK.
• Twyman, R. M. 2004. Principles of proteomics. BIOS Scientific Publishers, New York. ISBN 1-85996-273-4.(covers almost all branches of proteomics)
• Westermeier, R. and T. Naven. 2002. Proteomics in practice: a laboratory manual of proteome analysis. Wiley-VCH, Weinheim. ISBN 3-527-30354-5.(focused on 2D-gels, good on detail)
• Liebler, D. C. 2002. Introduction to proteomics: tools for the new biology. Humana Press, Totowa, NJ. ISBN 0-585-41879-9 (electronic, on Netlibrary?), ISBN 0-89603-991-9 hardback, ISBN 0-89603-992-7 paperback.
• Wilkins MR, Williams KL, Appel RD, Hochstrasser DF. Proteome research: new frontiers in functional genomics. Berlin Heidelberg, Springer Verlag; 1997, ISBN 3-540-62753-7.
• Arora, Pankaj S., et al. (2005). “Comparative evaluation of two two-dimensional gel electrophoresis image analysis software applications using synovial fluids from patients with joint disease”. Journal of Orthopaedic Science 10 (2): 160-166.[2]
• Rediscovering Biology Online Textbook. Unit 2 Proteins and Proteomics. 1997-2006.
• Weaver. R.F. Molecular Biology. Third Edition. The McGraw-Hill Companies Inc. 2005. pgs 840-849.
• Campbell and Reece. Biology. Sixth Edition. Pearson Education Inc. 2002. pg 392-393.
• Hye A, Lynham S, Thambisetty M, et al. ” Proteome-based plasma biomarkers for Alzheimer’s disease.” Brain 129: 3042-3050, (2006).
• Perroud B, Lee J, Valkova N, et al. “Pathway Analysis of Kidney Cancer Using Proteomics and *Metabolic Profiling.” Biomed Central: 65-82, (24 November 2006).
• Macaulay IC, Carr P, Gusnanto A, et al. “Platelet Genomics and Proteomics in Human Health and Disease.” The Journal of Clinical Investigation 115: 3370-3377, (December 2005).
• Rogers MA, Clarke P, Noble J, et al. “Proteomic Profiling of Urinary Proteins in Renal Cancer by Surface Enhanced Laser Desorption Ionization, and Neural-Network Analysis: Identification of Key Issues Affecting Clinical Potential Utility.” Cancer Research 63: 6971-6983, (15 October 2003).
• Vasan RS. “Biomarkers of cardiovascular disease: molecular basis and practical considerations” Circulation. 2006; 113:2335-2362.
• “Myocardial Infaction”. http://medlib.med.utah.edu/WebPath/TUTORIAL/MYOCARD/MYOCARD.html
• World Community Grid. http://www.worldcommunitygrid.org
• Introduction to Antibodies – Enzyme-Linked Immunosorbent Assay (ELISA). http://www.chemicon.com/resource/ ANT101/a2C.asp.
• Decramer S et al “Predicting the clinical outcome of congenital unilateral ureteropelvic junction obstruction in newborn by urinary proteome analysis” Nature Medicine 2006; 12:398-400
ELISA
The Enzyme-Linked ImmunoSorbent Assay, or ELISA, is a biochemical technique used mainly in immunology to detect the presence of an antibody or an antigen in a sample. The ELISA has been used as a diagnostic tool in medicine and plant pathology, as well as a quality control check in various industries. Performing an ELISA involves at least one antibody with specificity for a particular antigen. The sample with an unknown amount of antigen is immobilized on a solid support (usually a polystyrene microtiter plate) either non-specifically (via adsorption to the surface) or specifically (via capture by another antibody specific to the same antigen, in a “sandwich” ELISA). After the antigen is immobilized the detection antibody is added, forming a complex with the antigen. The detection antibody can be covalently linked to an enzyme, or can itself be detected by a secondary antibody which is linked to an enzyme through bioconjugation. Between each step the plate is typically washed with a mild detergent solution to remove any proteins or antibodies that are not specifically bound. After the final wash step the plate is developed by adding an enzymatic substrate to produce a visible signal, which indicates the quantity of antigen in the sample. Older ELISAs utilize chromogenic substrates, though newer assays employ fluorogenic substrates with much higher sensitivity. In simple terms, an unknown amount of antigen in a sample is immobilized on a surface. One then washes a particular antibody over the surface. This antibody is linked to an enzyme that visibly reacts when activated, say by light hitting it in the case of a fluorescent enzyme; the brightness of the fluorescence would then tell you how much antigen is in your sample.
The Enzyme ImmunoAssay (EIA) is a synonym for the ELISA.
Contents
1. Applications
2. History
3. Methods
3.1. Sandwich ELISA
3.2. Competitive ELISA
4. External links
5. References
1. Applications
Because the ELISA can be performed to evaluate either the presence of antigen or the presence of antibody in a sample, it is a useful tool both for determining serum antibody concentrations (such as with the HIV test[1] or West Nile Virus) and also for detecting the presence of antigen. It has also found applications in the food industry in detecting potential food allergens such as milk, peanuts, walnuts, almonds, and eggs.[2]
2. History
Prior to the development of the EIA/ELISA, immunoassays were conducted using radioactively-labeled antigens or antibodies in a technique called radioimmunoassay. The radioactivity provides the signal which indicates whether a specific antigen or antibody is present in the sample. Radioimmunoassay was first described in a paper by Rosalyn Sussman Yalow and Solomon Berson published in 1960[3].
Because radioactivity poses a health threat, a safer alternative was sought. A suitable alternative to radioimmunoassay would substitute a non-radioactive signal in place of the radioactive signal. When certain enzymes (such as peroxidase) react with appropriate substrates (such as ABTS or 3,3’,5,5’-Tetramethylbenzidine), they can result in changes in color, which can be used as a signal. However, the signal has to be associated with the presence of antibody or antigen, which is why the enzyme has to be linked to an appropriate antibody. This linking process was independently developed by Stratis Avrameas and G.B. Pierce[4]. Since it is necessary to remove any unbound antibody or antigen by washing, the antibody or antigen has to be fixed to the surface of the container, i.e. the immunosorbent has to be prepared. A technique to accomplish this was published by Wide and Porath in 1966[5]
In 1971, Peter Perlmann and Eva Engvall at Stockholm University in Sweden, as well as Anton Schuurs and Bauke van Weemen in The Netherlands, independently published papers which synthesized this knowledge into methods to perform EIA/ELISA[6][7]
3. Methods
The steps of the general, “indirect,” ELISA for determining serum antibody concentrations are:
(1). Apply a sample of known antigen to a surface, often the well of a microtiter plate. The antigen is fixed to the surface to render it immobile. Simple adsorption of the protein to the plastic surface is usually sufficient. These samples of known antigen concentrations will constitute a standard curve used to calculate antigen concentrations of unknown samples. Note that the antigen itself may be an antibody.
(2). The plate wells or other surface are then coated with serum samples of unknown antigen concentration, diluted into the same buffer used for the antigen standards. Since antigen immobilization in this step is due to non-specific adsorption, it is important for the total protein concentration to be similar to that of the antigen standards.
(3). A concentrated solution of non-interacting protein, such as Bovine Serum Albumin (BSA) or casein, is added to all plate wells. This step is known as blocking, because the serum proteins block non-specific adsorption of other proteins to the plate.
(4). The plate is washed, and a detection antibody specific to the antigen of interest is applied to all plate wells. This antibody will only bind to immobilized antigen on the well surface, not to other serum proteins or the blocking proteins.
(5). The plate is washed to remove any unbound detection antibody. After this wash, only the antibody-antigen complexes remain attached to the well.
(6). Secondary antibodies, which will bind to any remaining detection antibodies, are added to the wells. These secondary antibodies are conjugated to the substrate-specific enzyme. This step may be skipped if the detection antibody is conjugated to an enzyme.
(7). Wash the plate, so that excess unbound enzyme-antibody conjugates are removed.
(8). Apply a substrate which is converted by the enzyme to elicit a chromogenic or fluorogenic signal.
(9). View/quantify the result using a spectrophotometer, spectrofluorometer, or other optical device.
The enzyme acts as an amplifier; even if only few enzyme-linked antibodies remain bound, the enzyme molecules will produce many signal molecules. A major disadvantage of the indirect ELISA is that the method of antigen immobilization is non-specific; any proteins in the sample will stick to the microtiter plate well, so small concentrations of analyte in serum must compete with other serum proteins when binding to the well surface. The sandwich ELISA provides a solution to this problem.
ELISA may be run in a qualitative or quantitative format. Qualitative results provide a simple positive or negative result for a sample. The cutoff between positive and negative is determined by the analyst and may be statistical. Two or three times the standard deviation is often used to distinguish positive and negative samples. In quantitative ELISA, the optical density or fluorescent units of the sample is interpolated into a standard curve, which is typically a serial dilution of the target.
3.1. Sandwich ELISA
A less-common variant of this technique, called “sandwich” ELISA, is used to detect sample antigen. The steps are as follows:
(1). Prepare a surface to which a known quantity of capture antibody is bound.
(2). Block any non specific binding sites on the surface.
(3). Apply the antigen-containing sample to the plate.
(4). Wash the plate, so that unbound antigen is removed.
(5). Apply a detection antibody, with the same antigen specificity as the immobilized capture antibody.
(6). Apply enzyme-linked secondary antibodies which are specific to the detection antibodies.
(7). Wash the plate, so that the unbound antibody-enzyme conjugates are removed.
(8). Apply a chemical which is converted by the enzyme into a color or fluorescent signal.
(9). Measure the absorbance or fluorescence of the plate wells to determine the presence and quantity of antigen.
The image includes the use of a secondary antibody conjugated to an enzyme, though technically this is not necessary if the detection antibody is conjugated to an enzyme. However, use of a secondary-antibody conjugate avoids the expensive process of creating enzyme-linked antibodies for every antigen one might want to detect. By using an enzyme-linked antibody that binds the Fc region of other antibodies, this same enzyme-linked antibody can be used in a variety of situations. The major advantage of a sandwich ELISA is the ability to use crude or impure samples and still selectively bind any antigen that may be present. Without the first layer of “capture” antibody, any proteins in the sample (including serum proteins) may competitively adsorb to the plate surface, lowering the quantity of antigen immobilized.
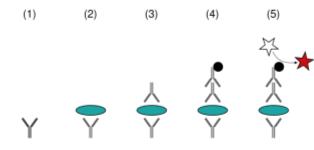
A sandwich ELISA. (1) Plate is coated with a capture antibody; (2) sample is added, and any antigen present binds to capture antibody; (3) detecting antibody is added, and binds to antigen; (4) enzyme-linked secondary antibody is added, and binds to detecting antibody; (5) substrate is added, and is converted by enzyme to detectable form.
3.2. Competitive ELISA
A third use of ELISA is through competitive binding. The steps for this ELISA are somewhat different than the first two examples:
(1). Unlabeled antibody is incubated in the presence of its antigen.
(2). These bound antibody/antigen complexes are then added to an antigen coated well.
(3). The plate is washed, so that unbound antibody is removed. (The more antigen in the sample, the less antibody will be able to bind to the antigen in the well, hence “competition.”)
(4). The secondary antibody, specific to the primary antibody is added. This second antibody is coupled to the enzyme.
(5). A substrate is added, and remaining enzymes elicit a chromogenic or fluorescent signal.
For competitive ELISA, the higher the original antigen concentration, the weaker the eventual signal.
4. External links
• Introduction to ELISA Activity
5. References
1. MedLinePlus. “HIV ELISA/western blot.” U.S. National Library of Medicine. Last accessed April 16, 2007. http://www.nlm.nih.gov/medlineplus/ency/article/003538.htm
2. U. S. Food and Drug Administration. “Food Allergen Partnership.” Last accessed April 16, 2007. http://www.cfsan.fda.gov/~dms/alrgpart.html
3. YALOW R, BERSON S (1960). “Immunoassay of endogenous plasma insulin in man”. J. Clin. Invest. 39: 1157-75.
4. Lequin R (2005). “Enzyme immunoassay (EIA)/enzyme-linked immunosorbent assay (ELISA).”. Clin. Chem. 51 (12): 2415-8.
5. Wide L, Porath J. Radioimmunoassay of proteins with the use of Sephadex-coupled antibodies. Biochem Biophys Acta 1966;30:257-260.
6. Engvall E, Perlman P (1971). “Enzyme-linked immunosorbent assay (ELISA). Quantitative assay of immunoglobulin G”. Immunochemistry 8 (9): 871-4.
7. Van Weemen BK, Schuurs AH (1971). “Immunoassay using antigen-enzyme conjugates.”. FEBS Letters 15 (3): 232-6.
Western blot
A western blot (alternately, immunoblot) is a method to detect a specific protein in a given sample of tissue homogenate or extract. It uses gel electrophoresis to separate native or denatured proteins by the length of the polypeptide (denaturing conditions) (Figure 1) or by the 3-D structure of the protein (native/ non-denaturing conditions). The proteins are then transferred to a membrane (typically nitrocellulose or PVDF), where they are probed (detected) using antibodies specific to the target protein. There are now many reagent companies that specialise in providing antibodies (both monoclonal and polyclonal antibodies) against many thousands of different proteins. This has dramatically reduced the time to carry out a blot. Previously large animals (e.g. sheep, goat – lots of serum) had to be immunised with the target protein twice (secondary immune response generates high affinity antibodies). Then either serum could be purified and used (polyclonal antibodies) or B cells could be isolated from the animal and fused in vitro with mouse myeloma cells to generate hybridomas that then provided single-specificity antibodies (monoclonal antibodies). Commercial antibodies are expensive, though can be re-used (unbound antibody) between experiments. This method is used in the fields of molecular biology, biochemistry, immunogenetics and other molecular biology disciplines.
Other related techniques include using antibodies to detect proteins in tissues and cells by immunostaining and enzyme-linked immnosorbent assay – ELISA.
The method originated from the laboratory of George Stark at Stanford. The name western blot was given to the technique by W. Neal Burnette[1] and is a play on the name Southern blot, a technique for DNA detection developed earlier by Edwin Southern. Detection of RNA is termed Northern blotting.
Contents
1. Steps in a western blot
1.1. Tissue preparation
1.2. Gel electrophoresis
1.3. Transfer
1.4. Blocking
1.5. Detection
1.5.1. Two step
1.5.2. One step
1.6. Analysis
1.6.1. Colorimetric detection
1.6.2. Chemiluminescence
1.6.3. Radioactive detection
1.6.4. Fluorescent detection
1.7. Secondary probing
2. 2-D Gel Electrophoresis
3. Medical diagnostic applications
4. Protocols
5. References
6. Related links
1. Steps in a western blot
1.1. Tissue preparation
Samples may be taken from whole tissue or from cell culture. In most cases, solid tissues are first broken down mechanically using a blender (for larger sample volumes), using a homogenizer (smaller volumes), or by sonication. Cells may also be broken open by one of the above mechanical methods.
Assorted detergents, salts, and buffers may be employed to encourage lysis of cells and to solubilize proteins. Protease inhibitors are often added to prevent the digestion of the sample by its own enzymes.
A combination of biochemical and mechanical techniques – including various types of filtration and centrifugation – can be used to separate different cell compartments and organelles.
1.2. Gel electrophoresis
The proteins of the sample are separated using gel electrophoresis. Separation of proteins may be by isoelectric point (pI), molecular weight, electric charge, or a combination of these factors. The nature of the separation depends on the treatment of the sample and the nature of the gel.
By far the most common type of gel electrophoresis employs polyacrylamide gels and buffers loaded with sodium dodecyl sulfate (SDS). SDS-PAGE (SDS polyacrylamide gel electrophoresis) maintains polypeptides in a denatured state once they have been treated with strong reducing agents to remove secondary and tertiary structure (e.g. S-S disulphide bonds to SH and SH) and thus allows separation of proteins by their molecular weight. Sampled proteins become covered in the negatively charged SDS and move to the positively charged electrode through the acrylamide mesh of the gel. Smaller proteins migrate faster through this mesh and the proteins are thus separated according to size (usually measured in kilo Daltons, kD). The concentration of acrylamide determines the resolution of the gel – the greater the acrylamide concentration the better the resolution of higher molecular weight proteins. Proteins travel only in one dimension along the gel for most blots.
Samples are loaded into wells in the gel. One lane is usually reserved for a marker or ladder, a commercially available mixture of proteins having defined molecular weights, typically stained so as to form visible, coloured bands. An example of a ladder is the GE Full Range Molecular weight ladder (Figure 1). When voltage is applied along the gel, proteins migrate into it at different speeds. These different rates of advancement (different electrophoretic mobilities) separate into bands within each lane.
It is also possible to use a two-dimensional (2-D) gel which spreads the proteins from a single sample out in two dimensions. Proteins are separated according to isoelectric point (pH at which they have neutral net charge) in the first dimension, and according to their molecular weight in the second dimension.
1.3. Transfer
In order to make the proteins accessible to antibody detection, they are moved from within the gel onto a membrane made of nitrocellulose or PVDF. The membrane is placed on top of the gel, and a stack of tissue papers placed on top of that. The entire stack is placed in a buffer solution which moves up the paper by capillary action, bringing the proteins with it. Another method for transferring the proteins is called electroblotting and uses an electric current to pull proteins from the gel into the PVDF or nitrocellulose membrane. The proteins have now moved from within the gel onto the membrane while maintaining the organization they had within the gel. As a result of this “blotting” process, the proteins are exposed on a thin surface layer for detection (see below). Both varieties of membrane are chosen for their non-specific protein binding properties (i.e. binds all proteins equally well). Protein binding is based upon hydrophobic interactions, as well as charged interactions between the membrane and protein. Nitrocellulose membranes are cheaper than PVDF, but are far more fragile and do not stand up well to repeated probings.
The uniformity and overall effectiveness of transfer of protein from the gel to the membrane can be checked by staining the membrane with Coomassie or Ponceau S dyes. Coomassie is the more sensitive of the two, although Ponceau S’s water solubility makes it easier to subsequently destain and probe the membrane as described below.
1.4. Blocking
Since the membrane has been chosen for its ability to bind protein, and both antibodies and the target are proteins, steps must be taken to prevent interactions between the membrane and the antibody used for detection of the target protein. Blocking of non-specific binding is achieved by placing the membrane in a dilute solution of protein – typically Bovine serum albumin (BSA) or non-fat dry milk (both are inexpensive), with a minute percentage of detergent such as Tween 20. The protein in the dilute solution attaches to the membrane in all places where the target proteins have not attached. Thus, when the antibody is added, there is no room on the membrane for it to attach other than on the binding sites of the specific target protein. This reduces “noise” in the final product of the Western blot, leading to clearer results, and eliminates false positives.
1.5. Detection
During the detection process the membrane is “probed” for the protein of interest with a modified antibody which is linked to a reported enzyme, which when exposed to an appropriate substrate drives a colorimetric reaction and produces a colour. For a variety of reasons, this traditionally takes place in a two-step process, although there are now one-step detection methods available for certain applications.
1.5.1. Two step
• Primary antibody
Antibodies are generated when a host species or immune cell culture is exposed to the protein of interest (or a part thereof). Normally, this is part of the immune response, whereas here they are harvested and used as sensitive and specific detection tools that bind the protein directly.
After blocking, a dilute solution of primary antibody (generally between 0.5 and 5 micrograms/ml) is incubated with the membrane under gentle agitation. Typically, the solution is comprised of buffered saline solution with a small percentage of detergent, and sometimes with powdered milk or BSA. The antibody solution and the membrane can be sealed and incubated together for anywhere from 30 minutes to overnight. It can also be incubated at different temperatures, with warmer temperatures being associated with more binding, both specific (to the target protein, the “signal”) and non-specific (“noise”).
• Secondary antibody
After rinsing the membrane to remove unbound primary antibody, the membrane is exposed to another antibody, directed at a species-specific portion of the primary antibody. This is known as a secondary antibody, and due to its targeting properties, tends to be referred to as “anti-mouse,” “anti-goat,” etc. Antibodies come from animal sources (or animal sourced hybridoma cultures); an anti-mouse secondary will bind to just about any mouse-sourced primary antibody. This allows some cost savings by allowing an entire lab to share a single source of mass-produced antibody, and provides far more consistent results. The secondary antibody is usually linked to biotin or to a reported enzyme such as alkaline phosphatase or horseradish peroxidase. This means that several secondary antibodies will bind to one primary antibody and enhances the signal.
Most commonly, a horseradish peroxidase-linked secondary is used in conjunction with a chemiluminescent agent, and the reaction product produces luminescence in proportion to the amount of protein. A sensitive sheet of photographic film is placed against the membrane, and exposure to the light from the reaction creates an image of the antibodies bound to the blot.
As with the ELISPOT and ELISA procedures, the enzyme can be provided with a substrate molecule that will be converted by the enzyme to a colored reaction product that will be visible on the membrane (see the figure below with blue bands).
A third alternative is to use a radioactive label rather than an enzyme coupled to the secondary antibody, such as labeling an antibody-binding protein like Staphylococcus Protein A with a radioactive isotope of iodine. Since other methods are safer, quicker and cheaper this method is now rarely used.
1.5.2. One step
Historically, the probing process was performed in two steps because of the relative ease of producing primary and secondary antibodies in separate processes. This gives researchers and corporations huge advantages in terms of flexibility, and adds an amplification step to the detection process. Given the advent of high-throughput protein analysis and lower limits of detection, however, there has been interest in developing one-step probing systems that would allow the process to occur faster and with less consumables. This requires a probe antibody which both recognizes the protein of interest and contains a detectable label, probes which are often available for known protein tags. The primary probe is incubated with the membrane in a manner similar to that for the primary antibody in a two-step process, and then is ready for direct detection after a series of wash steps.
1.6. Analysis
After the unbound probes are washed away, the western blot is ready for detection of the probes that are labeled and bound to the protein of interest. In practical terms, not all westerns reveal protein only at one band in a membrane. Size approximations are taken by comparing the stained bands to that of the marker or ladder loaded during electrophoresis. The process is repeated for a structural protein, such as actin or tubulin, that should not change between samples. The amount of target protein is indexed to the structural protein to control between groups. This practice ensures correction for the amount of total protein on the membrane in case of errors or incomplete transfers.
1.6.1. Colorimetric detection
The colorimetric detection method depends on incubation of the western blot with a substrate that reacts with the reporter enzyme (such as peroxidase) that is bound to the secondary antibody. This converts the soluble dye into an insoluble form of a different color that precipitates next to the enzyme and thereby stains the nitrocellulose membrane. Development of the blot is then stopped by washing away the soluble dye. Protein levels are evaluated through densitometry (how intense the stain is) or spectrophotometry.
1.6.2. Chemiluminescence
Chemiluminescent detection methods depend on incubation of the western blot with a substrate that will luminesce when exposed to the reporter on the secondary antibody. The light is then detected by photographic film, and more recently by CCD cameras which captures a digital image of the western blot. The image is analysed by densitometry, which evaluates the relative amount of protein staining and quantifies the results in terms of optical density. Newer software allows further data analysis such as molecular weight analysis if appropriate standards are used. So-called “enhanced chemiluminescent” (ECL) detection is considered to be among the most sensitive detection methods for blotting analysis.
1.6.3. Radioactive detection
Radioactive labels do not require enzyme substrates, but rather allow the placement of medical X-ray film directly against the western blot which develops as it is exposed to the label and creates dark regions which correspond to the protein bands of interest (see image to the right). The importance of radioactive detections methods is declining, because it is very expensive, health and safety risks are high and ECL provides a useful alternative.
1.6.4. Fluorescent detection
The fluorescently labeled probe is excited by light and the emission of the excitation is then detected by a photosensor such as CCD camera equipped with appropriate emission filters which captures a digital image of the western blot and allows further data analysis such as molecular weight analysis and a quantitative western blot analysis. Fluorescence is considered to be among the most sensitive detection methods for blotting analysis.
1.7. Secondary probing
One major difference between nitrocellulose and PVDF membranes relates to the ability of each to support “stripping” antibodies off and reusing the membrane for subsequent antibody probes. While there are well-established protocols available for stripping nitrocellulose membranes, the sturdier PVDF allows for easier stripping, and for more reuse before background noise limits experiments. Another difference is that, unlike nitrocellulose, PVDF must be soaked in 95% ethanol, isopropanol or methanol before use. PVDF membranes also tend to be thicker and more resistant to damage during use.
2. 2-D Gel Electrophoresis
2-dimensional SDS-PAGE uses the principles and techniques outlined above. 2-D SDS-PAGE, as the name suggests, involves the migration of polypeptides in 2 dimensions. In the first dimension polypeptides are separated according to [isolelectric point]. In the second dimension polypeptides are separated according to their [molecular weight]. The isoelectric point of a given protein is determined by the relative number of positively (e.g. lysine) and negatively (e.g. glutamate) amino acids, with negatively charged amino acids contributing to a high isoelectric point and positively charged amino acids contributing to a low isoelectric point.
This method allows for the separation in principle of all cellular proteins on a single very large gel. A major advantage of this method is that it often distinguishes between different isoforms of a particular protein – e.g. a protein that has been phosphorylated (addition of a negatively charged group). Proteins that have been separated can be cut out of the gel and then analysed by mass spectrometry, which identifies the protein.
3. Medical diagnostic applications
• The confirmatory HIV test employs a western blot to detect anti-HIV antibody in a human serum sample. Proteins from known HIV-infected cells are separated and blotted on a membrane as above. Then, the serum to be tested is applied in the primary antibody incubation step; free antibody is washed away, and a secondary anti-human antibody linked to an enzyme signal is added. The stained bands then indicate the proteins to which the patient’s serum contains antibody.
• A Western blot is also used as the definitive test for Bovine spongiform encephalopathy (BSE, commonly referred to as ‘mad cow disease’).
• Some forms of Lyme disease testing employ Western blotting.
4. Protocols
Dr. Mark Barton Frank Lab protocol
5. References
1. W. Neal Burnette (April 1981). “‘Western blotting’: electrophoretic transfer of proteins from sodium dodecyl sulfate — polyacrylamide gels to unmodified nitrocellulose and radiographic detection with antibody and radioiodinated protein A”. Anal Biochem 112 (2): 195-203.
• Renart J, Reiser J, Stark GR. “Transfer of proteins from gels to diazobenzyloxymethyl-paper and detection with antisera: a method for studying antibody specificity and antigen structure”, Proc Natl Acad Sci U S A, 1979 Jul;76(7):3116-20.
• Towbin H, Staehelin T, Gordon J. “Electrophoretic transfer of proteins from polyacrylamide gels to nitrocellulose sheets: procedure and some applications” Proc Natl Acad Sci U S A, 1979 Sep;76(9):4350-4.
• Citation’s Classic: Burnette
6. Related links
• Western blot analysis of sub-cellular fractionated samples using the Odyssey Infrared Imaging System (a protocol)
• Western blot protocol including example buffers and reprobing procedure
