
HPLC & MS
This entry is from Wikipedia, the leading user-contributed encyclopedia.
• HPLC
• ANP chromatography
• Size exclusion chromatography
• Ion exchange chromatography
• MALDI
• ESI
• Tandem mass spectrometry
• LC-MS
HPLC
High-performance liquid chromatography (HPLC) is a form of column chromatography used frequently in biochemistry and analytical chemistry. It is also sometimes referred to as high-pressure liquid chromatography. HPLC is used to separate components of a mixture by using a variety of chemical interactions between the substance being analyzed (analyte) and the chromatography column.
Contents
1. Operation
2. Types of HPLC
2.1. Normal phase chromatography
2.2. Reversed phase chromatography
2.3. Size exclusion chromatography
2.4. Ion exchange chromatography
2.5. Bioaffinity chromatography
2.6. Isocratic flow and gradient elution
3. Parameters
3.1. Internal diameter
3.2. Particle size
3.3. Pore size
3.4. Pump pressure
4. References
1. Operation
The basic operating principle of HPLC is to force the analyte through a column of the stationary phase (usually a tube packed with small round particles with a certain surface chemistry) by pumping a liquid (mobile phase) at high pressure through the column. The sample to be analyzed is introduced in small volume to the stream of mobile phase and is retarded by specific chemical or physical interactions with the stationary phase as it traverses the length of the column. The amount of retardation depends on the nature of the analyte, stationary phase and mobile phase composition. The time at which a specific analyte elutes (comes out of the end of the column) is called the retention time and is considered a reasonably unique identifying characteristic of a given analyte. The use of pressure increases the linear velocity (speed) giving the components less time to diffuse within the column, leading to improved resolution in the resulting chromatogram. Common solvents used include any miscible combinations of water or various organic liquids (the most common are methanol and acetonitrile). Water may contain buffers or salts to assist in the separation of the analyte components, or compounds such as Trifluoroacetic acid which acts as an ion pairing agent.
A further refinement to HPLC has been to vary the mobile phase composition during the analysis, this is known as gradient elution. A normal gradient for reversed phase chromatography might start at 5% methanol and progress linearly to 50% methanol over 25 minutes, depending on how hydrophobic the analyte is. The gradient separates the analyte mixtures as a function of the affinity of the analyte for the current mobile phase composition relative to the stationary phase. This partitioning process is similar to that which occurs during a liquid-liquid extraction but is continuous, not step-wise. In this example, using a water/methanol gradient, the more hydrophobic components will elute (come off the column) under conditions of relatively high methanol; whereas the more hydrophilic compounds will elute under conditions of relatively low methanol. The choice of solvents, additives and gradient depend on the nature of the stationary phase and the analyte. Often a series of tests are performed on the analyte and a number of generic runs may be processed in order to find the optimum HPLC method for the analyte – the method which gives the best separation of peaks.
2. Types of HPLC
2.1. Normal phase chromatography
Normal phase HPLC (NP-HPLC) was the first kind of HPLC chemistry used, and separates analytes based on polarity. This method uses a polar stationary phase and a nonpolar mobile phase, and is used when the analyte of interest is fairly polar in nature. The polar analyte associates with and is retained by the polar stationary phase. Adsorption strengths increase with increase in analyte polarity, and the interaction between the polar analyte and the polar stationary phase (relative to the mobile phase) increases the elution time. The interaction strength not only depends on the functional groups in the analyte molecule, but also on steric factors and structural isomers are often resolved from one another. Use of more polar solvents in the mobile phase will decrease the retention time of the analytes while more hydrophobic solvents tend to increase retention times. Particularly polar solvents in a mixture tend to deactivate the column by occupying the stationary phase surface. This is somewhat particular to normal phase because it is most purely an adsorptive mechanism (the interactions are with a hard surface rather than a soft layer on a surface)..
NP-HPLC had fallen out of favor in the 1970’s with the development of reversed-phase HPLC because of a lack of reproducibility of retention times as water or protic organic solvents changed the hydration state of the silica or alumina chromatographic media. Recently it has become useful again with the development of HILIC bonded phases which utilize a partition mechanism which provides reproducibility.
2.2. Reversed phase chromatography
Reversed phase HPLC (RP-HPLC) consists of a non-polar stationary phase and an aqueous, moderately polar mobile phase. One common stationary phase is a silica which has been treated with RMe2SiCl, where R is a straight chain alkyl group such as C18H37 or C8H17. The retention time is therefore longer for molecules which are more non-polar in nature, allowing polar molecules to elute more readily. Retention time is increased by the addition of polar solvent to the mobile phase and decreased by the addition of more hydrophobic solvent. Reversed phase chromatography (short RPC) is so commonly used that it is not uncommon for it to be incorrectly referred to as “HPLC” without further specification. The pharmaceutical industry regularly employs RPC to qualify drugs before their release.
RPC operates on the principle of hydrophobic interactions, which result from repulsive forces between a polar eluent, the relatively non-polar analyte, and the non-polar stationary phase. The binding of the analyte to the stationary phase is proportional to the contact surface area around the non-polar segment of the analyte molecule upon association with the ligand in the aqueous eluent. This solvophobic effect is dominated by the force of water for “cavity-reduction” around the analyte and the C18-chain versus the complex of both. The energy released in this process is proportional to the surface tension of the eluent (water: 73 erg/cm2, methanol: 22 erg/cm2) and to the hydrophobic surface of the analyte and the ligand respectively. The retention can be decreased by adding less-polar solvent (MeOH, ACN)into the mobile phase to reduce the surface tension of water. Gradient elution uses this effect by automatically changing the polarity of the mobile phase during the course of the analysis.
Structural properties of the analyte molecule play an important role in its retention characteristics. In general, an analyte with a larger hydrophobic surface area (C-H, C-C, and generally nonpolar atomic bonds, such as S-S and others) results in a longer retention time because it increases the molecule’s nonpolar surface area, which is non-interacting with the water structure. On the other hand, polar groups, such as -OH, -NH2, COO- or -NH3+ are reducing retention as they are well integrated into water. Very large molecules, however, can result in an incomplete interaction between the large analyte surface and the ligands alkyl chains and can have problems entering the pores of the stationary phase.
Retention time increases with hydrophobic – nonpolar – surface area. Branched chain compounds elute more rapidly than their corresponding linear isomers because the overall surface area is decreased. Similarly organic compounds with single C-C-bonds elute later than the ones with a C=C or C-C-triple bond, as the double or triple bond is shorter than a single C-C-bond.
Aside from mobile phase surface tension (organizational strength in eluent structure), other mobile phase modifiers can affect analyte retention. For example, the addition of inorganic salts causes a moderate linear increase in the surface tension of aqueous solutions (ca. 1.5 erg/cm2 pro Mol for NaCl, 2.5 erg/cm2 pro Mol for (NH4)2SO4), and because the entropy of the analyte-solvent interface is controlled by surface tension, the addition of salts tend to increase the retention time. This technique is used for mild separation and recovery of proteines and protection of their biological activity in protein analysis (hydrophobic interaction chromatography, HIC).
Another important component is the influence of the pH since this can change the hydrophobicity of the analyte. For this reason most methods use a buffering agent, such as sodium phosphate, to control the pH. A volatile organic acid such as formic acid or most commonly trifluoroacetic acid is often added to the mobile phase, if mass spectrometry is applied to the eluent fractions. The buffers serve multiple purposes: they control pH, neutralize the charge on any residual exposed silica on the stationary phase and act as ion pairing agents to neutralize charge on the analyte. The effect varies depending on use but generally improve the chromatography.
Reversed phase columns are quite difficult to damage compared with normal silica columns, however, many reversed phase columns consist of alkyl derivatized silica particles and should never be used with aqueous bases as these will destroy the underlying silica backbone. They can be used with aqueous acid but the column should not be exposed to the acid for too long, as it can corrode the metal parts of the HPLC equipment. The metal content of HPLC columns must be kept low if the best possible ability to separate substances is to be retained. A good test for the metal content of a column is to inject a sample which is a mixture of 2,2′- and 4,4′- bipyridine. Because the 2,2′-bipy can chelate the metal it is normal that when a metal ion is present on the surface of the silica the shape of the peak for the 2,2′-bipy will be distorted, tailing will be seen on this distorted peak.
2.3. Size exclusion chromatography
Size exclusion chromatography (SEC), also known as gel permeation chromatography or gel filtration chromatography, separates particles on the basis of size. It is generally a low resolution chromatography and thus it is often reserved for the final, “polishing” step of a purification. It is also useful for determining the tertiary structure and quaternary structure of purified proteins, and is the primary technique for determining the average molecular weight of natural and synthetic polymers.
2.4. Ion exchange chromatography
In Ion-exchange chromatography, retention is based on the attraction between solute ions and charged sites bound to the stationary phase. Ions of the same charge are excluded. Some types of Ion Exchangers include: (1) Polystyrene resins- allows cross linkage which increases the stability of the chain. Higher cross linkage reduces swerving, which increases the equilibration time and ultimately improves selectivity. (2) Cellulose and dextran ion exchangers (gels)-These possess larger pore sizes and low charge densities making them suitable for protein separation.(3)Controlled-pore glass or porous silica.
In general, ion exchangers favor the binding of ions of higher charge and smaller radius.
An increase in counter ion (with respect to the functional groups in resins) concentration reduces the retention time. An increase in pH reduces the retention time in cation exchange while a decrease in pH reduces the retention time in anion exchange.
This form of chromatography is widely used in the following applications: In purifying water, preconcentration of trace components, Ligand-exchange chromatography, Ion-exchange chromatography of proteins, High-pH anion-exchange chromatography of carbohydrates and oligosaccharides, etc.
2.5. Bioaffinity chromatography
This chromatographic process relies on the property of biologically active substances to form stable, specific, and reversible complexes. The formation of these complexes involves the participation of common molecular forces such as the Van der Waal’s interaction, electrostatic interaction, dipole-dipole interaction, hydrophobic interaction, and the hydrogen bond. An efficient, biospecific bond is formed by a simultaneous and concerted action of several of these forces in the complementary binding sites.
2.6. Isocratic flow and gradient elution
With regard to the mobile phase, a composition that remains constant throughout the procedure is termed isocratic.
In contrast to this is the so called “gradient elution”, which is a separation where the mobile phase changes its composition during a separation process. One example is a gradient in 20 min starting from 10% Methanol and ending up with 30% Methanol. Such a gradient can be increasing or decreasing. The benefit of gradient elution is that it helps speed up elution by allowing components that elute more quickly to come off the column under different conditions than components which are more readily retained by the column. By changing the composition of the solvent, components that are to be resolved can be selectively more or less associated with the mobile phase as a result at equilibrium they spend more time in the solvent and less in the stationary phase therefore they elute faster.
3. Parameters
3.1. Internal diameter
The internal diameter (ID) of an HPLC column is a critical aspect that determines quantity of analyte that can be loaded onto the column and also influences sensitivity. Larger columns are usually seen in industrial applications such as the purification of a drug product for later use. Low ID columns have improved sensitivity and lower solvent consumption at the expense of loading capacity.
• Larger ID columns (over 10 mm) are used to purify usable amounts of material because of their large loading capacity.
• Analytical scale columns (4.6 mm) have been the most common type of columns, though smaller columns are rapidly gaining in popularity. They are used in traditional quantitative analysis of samples and often use a UV-Vis absorbance detector.
• Narrow-bore columns (1-2 mm) are used for applications when more sensitivity is desired either with special UV-vis detectors, fluorescence detection or with other detection methods like liquid chromatography-mass spectrometry
• Capillary columns (under 0.3 mm) which are used almost exclusively with alternative detection means such as mass spectrometry. They are usually made from fused silica capillaries, rather than the stainless steel tubing that larger columns employ.
3.2. Particle size
Most traditional HPLC is performed with the stationary phase attached to the outside of small spherical silica particles (very small beads). These particles come in a variety of sizes with 5μm beads being the most common. Smaller particles generally provide more surface area and better separations, but the pressure required for optimum linear velocity increases by the inverse of the particle diameter squared 1,2. This means that changing to particles that are half as big in the same size of column will double the performance, but increase the required pressure by a factor of four. Larger particles are more often used in non-HPLC applications such as solid-phase extraction.
3.3. Pore size
Many stationary phases are porous to provide greater surface area. Small pores provide greater surface area while larger pore size has better kinetics especially for larger analytes. For example a protein which is only slightly smaller than a pore might enter the pore but not easily leave once inside.
3.4. Pump pressure
Pumps vary in pressure capacity, but their performance is measured on their ability to yield a consistent and reproducible flow rate. Pressure may reach as high as 6000 lbf/in² (~40 MPa, or about 400 atmospheres). Modern HPLC systems have been improved to work at much higher pressures, and therefore be able to use much smaller particle sizes in the columns (< 2 micrometres). These “Ultra High Performance Liquid Chromatography” systems or UHPLCs can work at up to 15,000 lbf/in² (~100 MPa or about 1000 atmospheres). Note that the term “UPLC”, sometimes found instead is a trademark of Waters Corporation and not the name for the technique in general.
4. References:
1.Y. Xiang, Y. Liu and M. L. Lee; J. Chrom. A, Vol. 1104, Issues 1-2, (2006), Pages 198-202
2. Cs.Horváth, B.A. Preiss and S.R. Lipsky; Anal. Chem., 39, 1422–1428 (1967).
Aqueous normal phase chromatography
Aqueous normal phase chromatography (ANP) is a chromatographic technique which encompasses the mobile phase region between reversed-phase chromatography (RP) and organic normal phase chromatography (ONP).
In normal phase chromatography, the stationary phase is polar and the mobile phase is nonpolar. In reversed phase we have just the opposite; the stationary phase is nonpolar and the mobile phase is polar. Typical stationary phases for normal phase chromatography are silica or organic moieties with cyano and amino functional groups. For reversed phase, alkyl hydrocarbons are the preferred stationary phase; octadecyl (C18) is the most common stationary phase, but octyl (C8) and butyl (C4) are also used in some applications. The designations for the reversed phase materials refer to the length of the hydrocarbon chain.
In normal phase chromatography, the most nonpolar compounds elute first and the most polar compounds elute last. The mobile phase consists of a very nonpolar solvent like hexane or heptane mixed with a slightly more polar solvent like isopropanol, ethyl acetate or cholorform. Retention increases as the amount of nonpolar solvent in the mobile phase increases. In reversed phase chromatography, the most polar compounds elute first with the most nonpolar compounds eluting last. The mobile phase is generally a binary mixture of water and a miscible polar organic solvent like methanol, acetonitrile or THF. Retention increases as the amount of the polar solvent (water) in the mobile phase increases. Normal phase chromatography, an adsorptive mechanism, is used for the analysis of solutes readily soluble in organic solvents, based on their polar differences such as amines, acids, metal complexes, etc.. Reversed phase chromatography, a partition mechanism, is typically used for separations by non-polar differences.
A third type of silica has been developed, using stationary phases based on hydride surfaces[1]. It has been incorrectly referred to as aqueous normal phase chromatography (ANP) for two fundamental reasons, the first of which is that ANP more appropriately describes HILIC chromatography, where water must be present to permit the partitioning of solutes in a “normal phase” order. Secondly, it has been shown in publications studying the derivatization of hydride surfaces, that the normal phase character is the result of residual siilanol groups, rather than the fundamental contribution of the hydride. If the (mixed) hydride phase is end capped, then the retention by polar groups decreases, indicating the unique performance is not from the hydride. This is similar to the Hearn observation of increased retention under high acetonitrile (ACN) on acidic, silica based, reversed phase columns, a U-shaped plot of retention versus ACN concentration.
The “hydride surfaces” distinguish the support material from other silica materials; most silica materials used for chromatography have a surface composed primarily of silanols (-Si-OH). In a “hydride surface” the terminal groups are primarily -Si-H. The hydride surface can also be functionalized with carboxylic acids[2] and long-chain alkyl groups[3]. Mobile phases for ANPC are based on an organic solvent (such as methanol or acetonitrile) with a small amount of water; thus, the mobile phase is both “aqueous” (water is present) and “normal” (less polar than the stationary phase). Thus, polar solutes (such as acids and amines) are most strongly retained, with retention decreasing as the amount of water in the mobile phase increases.
Typically the amount of the nonpolar component in the mobile phase must be 60% or greater with the exact point of increased retention depending on the solute and the organic component of the mobile phase. A true ANP stationary phase will be able to function in both the reversed phase and normal phase modes with only the amount of water in the eluent varying. Thus a continuum of solvents can be used from 100% aqueous to pure organic. ANP retention has been demonstrated for a variety of polar compounds on the hydride based stationary phases (J.J. Pesek, M.T. Matyska, J. Sep. Sci., in press).
An interesting feature of these phases is that both polar and nonpolar compounds can be retained over some range of mobile phase composition (organic/aqueous) as a result of residual silanol groups acting in a HILIC mode. This property distinguishes it from a pure HILIC (hydrophilic interaction chromatography) column where separation by polar differences is obtained, or a pure RP stationary phase on which separation by nonpolar differences in solutes is obtained with very limited secondary mechanisms operating.
Another important feature of the hydride-based phases is that for many analyses it is usually not necessary to use a high pH mobile phase to analyze polar compounds such as bases. The aqueous component of the mobile phase usually contains from 0.1 to 0.5% formic or acetic acid, which is compatible with detector techniques that include mass spectral analysis.
References
1. J.J. Pesek, M.T. Matyska, LCGC, 24 (2006) 296
2. J.J. Pesek, M.T. Matsyka, J. Sep. Sci. 28 (18): 2437-2443
3. Pesek JJ, Matyska MT, Gangakhedkar S, et al., J. Sep. Sci. 29 (6): 872-880
4. Hemstrom, P. and Irgum, K., J. Sep. Sci. 29 (12): 1784-1821
Size exclusion chromatography
Size exclusion chromatography (SEC) is a chromatographic method in which particles are separated based on their size, or in more technical terms, their hydrodynamic volume. It is usually applied to large molecules or macromolecular complexes such as proteins and industrial polymers. When an aqueous solution is used to transport the sample through the column, the technique is known as gel filtration chromatography. The name gel permeation chromatography is used when an organic solvent is used as a mobile phase. The main application of gel filtration chromatography is the fractionation of proteins and other water-soluble polymers, while gel permeation chromatography is used to analyze the molecular weight distribution of organic-soluble polymers. Either technique should not be confused with gel electrophoresis, where an electric field is used to “pull” or “push” molecules through the gel depending on their electrical charges.
SEC is a widely used technique for the purification and analysis of synthetic and biological polymers, such as proteins, polysaccharides and nucleic acids. Biologists and biochemists typically use a gel medium — usually polyacrylamide, dextran or agarose — and filter under low pressure. Polymer chemists typically use either a silica or crosslinked polystyrene medium under a higher pressure. These media are known as the stationary phase.
The advantage of this method is that the various solutions can be applied without interfering with the filtration process, while preserving the biological activity of the particles to be separated. The technique is generally combined with others that further separate molecules by other characteristics, such as acidity, basicity, charge, and affinity for certain compounds.
Contents
1. Discovery
2. Theory and method
3. Factors affecting filtration
4. Analysis
5. Applications
5.1. Proteomics
5.2. Polymer synthesis
6. References
1. Discovery
The technique was invented by Grant Henry Lathe and Colin R Ruthven, working at Queen Charlotte’s Hospital, London [1][2]. They later received the John Scott Award for this invention [3]. While Lathe and Ruthven used starch gels as the matrix, Porath and Flodin later introduced dextran gels [4]; other gels with size fractionation properties include agarose and polyacrylamide. A short review of these developments has appeared [5].
2. Theory and method
The underlying principle of SEC is that particles of different sizes will elute (filter) through a stationary phase at different rates. This results in the separation of a solution of particles based on size. Provided that all the particles are loaded simultaneously or near simultaneously, particles of the same size should elute together.
This is usually achieved with an apparatus called a column, which consists of a hollow tube tightly packed with extremely small porous polymer beads designed to have pores of different sizes. These pores may be depressions on the surface or channels through the bead. As the solution travels down the column some particles enter into the pores. Larger particles cannot enter into as many pores. The larger the particles, the less overall volume to traverse over the length of the column, and the faster the elution.
The filtered solution that is collected at the end is known as the eluent. The void volume consists of any particles too large to enter the medium, and the solvent volume is known as the column volume.
3. Factors affecting filtration
A cartoon illustrating the theory behind size exclusion chromatographyIn real life situations particles in solution do not have a constant, fixed size, resulting in the probability that a particle which would otherwise be hampered by a pore may pass right by it. Also, the stationary phase particles are not ideally defined; both particles and pores may vary in size. Elution curves therefore resemble gaussian distributions. The stationary phase may also interact in undesirable ways with a particle and influence retention times, though great care is taken by column manufacturers to use stationary phases which are inert and minimize this issue.
Like other forms of chromatography, increasing the column length will tighten the resolution, and increasing the column diameter increases the capacity of the column. Proper column packing is important to maximize resolution: an overpacked column can collapse the pores in the beads, resulting in a loss of resolution. An underpacked column can reduce the relative surface area of the stationary phase accessible to smaller species, resulting in those species spending less time trapped in pores.
A cartoon illustrating the theory behind size exclusion chromatography
4. Analysis
In simple manual columns the eluent is collected in constant volumes, known as fractions. The more similar the particles are in size, the more likely they will be in the same fraction and not detected separately. More advanced columns overcome this problem by constantly monitoring the eluent.
The collected fractions are often examined by spectroscopic techniques to determine the concentration of the particles eluted. Three common spectroscopy detection techniques are refractive index (RI), evaporative light scattering (ELS), and ultraviolet (UV). When eluting spectroscopically similar species (such as during biological purification) other techniques may be necessary to identify the contents of each fraction. The elution volume decreases roughly linearly with the logarithm of the molecular hydrodynamic volume (often assumed to be proportional to molecular weight). Columns are often calibrated using 4-5 standard samples (e.g., folded proteins of known molecular weight) to determine the void volume and the slope of the logarithmic dependence. This calibration may need to be repeated under different solution conditions.
5. Applications
5.1. Proteomics
SEC is generally considered a low resolution chromatography as it does not discern similar species very well, and is therefore often reserved for the final “polishing” step of a purification. The technique can determine the quaternary structure of purified proteins which have slow exchange times, since it can be carried out under native solution conditions, preserving macromolecular interactions. SEC can also assay protein tertiary structure as it measures the hydrodynamic volume (not molecular weight), allowing folded and unfolded versions of the same protein to be distinguished. For example, the apparent hydrodynamic radius of a typical protein domain might be 14 Å and 36 Å for the folded and unfolded forms respectively. SEC allows the separation of these two forms as the folded form will elute much later due to its smaller size. Alternatively, folded and unfolded versions of the same metalloproteins can be separated according to their different isoelectric points by using quantitative preparative native continuous polyacrylamide gel electrophoresis (QPNC-PAGE).
5.2. Polymer synthesis
SEC can be used as a measure of both the size and the polydispersity of a synthesised polymer – that is, the to be able to find distribution of sizes of polymer molecules. If standards of a known size are run previously, then a calibration curve can be created to determine the sizes of polymer molecules of interest. Alternatively, techniques such as light scattering and/or viscometry can be used online with SEC to yield absolute molecular weights that do not rely on calibration with standards of known molecular weight. Due to the difference in size of two polymers with identical molecular weights, the absolute determination methods are generally more desirable. A typical SEC system can quickly (in about half an hour) give polymer chemists information on the size and polydispersity of the sample.
6. References
1. Lathe, GH and Ruthven, CR (1955) The separation of substances on the basis of their molecular weights, using columns of starch and water. Biochem J. 60(4): xxxiv.
2. Lathe, GH and Ruthven, CR (1956) The separation of substances and estimation of their relative molecular sizes by the use of columns of starch in water. Biochem. J. 62(4): 665-674.
3. John Scott Award
4. Porath, J and Flodin, P (1959) Gel filtration: A method for desalting and group separation. Nature 183(4676): 1657-1659.
5. Eisenstein, M (2006) A look back, adventures in the matrix. Nature Methods 3(5): 410
Ion exchange chromatography
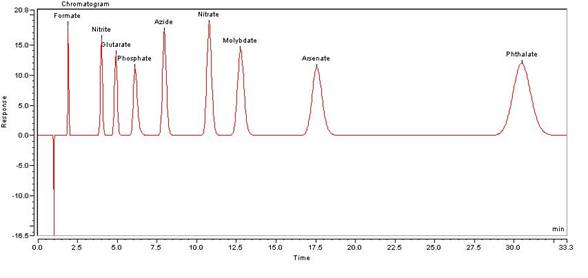
Ion-exchange chromatography (or ion chromatography) is a process that allows the separation of ions and polar molecules based on the charge properties of the molecules. It can be used for almost any kind of charged molecule including large proteins, small nucleotides and amino acids. The solution to be injected is usually called a sample, and the individually separated components are called analytes. It is often used in protein purification, water analysis, and quality control.
Contents
1. History
2. Principle
3. Separating Proteins
4. Typical Technique
5. References
1. History
Ion methods have been in use since 1850, when H. Thompson and J. T. Way, researchers in England, treated various clays with ammonium sulfate or carbonate in solution to extract the ammonia and release calcium. In 1927, the first zeolite mineral column was used to remove interfering calcium and magnesium ions from solution to determine the sulfate content of water. The modern version of IEC was developed during the wartime Manhattan Project. A technique was required to separate and concentrate the radioactive elements needed to make the atom bomb. Researchers chose adsorbents that would latch onto charged transuranium elements, which could then be differentially eluted. Ultimately, once declassified, these techniques would use new IE resins to develop the systems that are often used today for specific purification of biologicals and inorganics. In the early 1970s, ion chromatography was developed by Hamish Small and co-workers at Dow Chemical Company as a novel method of IEC usable in automated analysis. IC uses weaker ionic resins for its stationary phase and an additional neutralizing stripper, or suppressor, column to remove background eluent ions. It is a powerful technique for determining low concentrations of ions and is especially useful in environmental and water quality studies, among other applications.
The Dow Chemical Company technology was acquired by Durrum Instrument Corp. (maker of the Durrum_D-500), which later formed a separate business unit for its new IC products, naming it Dionex (Dow Ion Exchange). Dionex Corporation was incorporated in Sunnyvale, California in 1980, and, led by A. Blaine Bowman, purchased the Dionex assets.
2. Principle
Ion exchange chromatography retains analyte molecules based on coulombic (ionic) interactions. The stationary phase surface displays ionic functional groups that interact with analyte ions of opposite charge. This type of chromatography is further subdivided into cation exchange chromatography and anion exchange chromatography:
• Cation exchange chromatography retains positively charged cations because the stationary phase displays a negatively charged functional group such as a phosphoric acid
• Anion exchange chromatography retains negatively charged anions using positively charged functional group such as a quaternary ammonium cation
3. Separating Proteins
Proteins have numerous functional groups that can have both positive and negative charges. Ion exchange chromatography separates proteins according to their net charge, which is dependent on the composition of the mobile phase. By adjusting the pH or the ionic concentration of the mobile phase, various protein molecules can be separated. For example, if a protein has a net positive charge at pH 7, then it will bind to a column of negatively-charged beads, whereas a negatively charged protein would not. By changing the pH so that the net charge on the protein is negative, it too will be eluted.
Elution by changing the ionic strength of the mobile phase is a more subtle effect – it works as ion from the mobile phase will interact with the immobilized ion in preference over those on the stationary phase. This “shields” the stationary phase from the protein, (and vice versa) and allows the protein to elute.
4. Typical Technique
A sample is introduced, either manually or with an autosampler, into a sample loop of known volume. A buffered aqueous solution known as the mobile phase carries the sample from the loop onto a column that contains some form of stationary phase material. This is typically a resin or gel matrix consisting of agarose or cellulose beads with covalently bonded charged functional groups. The target analytes (anions or cations) are retained on the stationary phase but can be eluted by increasing the concentration of a similarly charged species that will displace the analyte ions from the stationary phase. For example, in cation exchange chromatography, the positively charged analyte could be displaced by the addition of positively charged sodium ions. The analytes of interest must then be detected by some means, typically by conductivity or UV/Visible light absorbance.
In order to control an IC system, a Chromatography Data System (CDS) is usually needed. In addition to IC systems, some of these CDSs can also control Gas Chromatography (GC) and HPLC systems.
5. References
• Handbook of Ion Chromatography. Joachim Weiss, Dionex Corporation. ISBN 978-3527287017
MALDI
Matrix-assisted laser desorption/ionization (MALDI) is a soft ionization technique used in mass spectrometry, allowing the analysis of biomolecules (biopolymers such as proteins, peptides and sugars) and large organic molecules (such as polymers, dendrimers and other macromolecules), which tend to be fragile and fragment when ionized by more conventional ionization methods. It is most similar in character to electrospray ionization both in relative softness and the ions produced (although it causes much fewer multiply charged ions).
The ionization is triggered by a laser beam (normally a nitrogen laser). A matrix is used to protect the biomolecule from being destroyed by direct laser beam and to facilitate vaporization and ionization.
Contents
1. Matrix
2. Laser
3. AP-MALDI
4. Mass spectrometer
5. History
6. Use
6.1. In Biochemistry
6.2. In Organic Chemistry
7. Problems
8. References
1. Matrix
The matrix consists of crystallized molecules, of which the three most commonly used are 3,5-dimethoxy-4-hydroxycinnamic acid (sinapinic acid), α-cyano-4-hydroxycinnamic acid (alpha-cyano or alpha-matrix) and 2,5-dihydroxybenzoic acid (DHB). A solution of one of these molecules is made, often in a mixture of highly purified water and an organic solvent (normally acetonitrile (ACN) or ethanol). Trifluoroacetic acid (TFA) may also be added. A good example of a matrix-solution would be 20 mg/mL sinapinic acid in ACN:water:TFA (50:50:0.1).
Matrix-assisted laser desorption ionization depicted with matrix in blue and analyte in red
The identity of suitable matrix compounds is determined to some extent by trial and error, but they are based on some specific molecular design considerations:
They are of a fairly low molecular weight (to allow facile vaporization), but are large enough (with a high enough vapor pressure) not to evaporate during sample preparation or while standing in the spectrometer.
They are acidic; therefore act as a proton source to encourage ionization of the analyte.
They have a strong optical absorption in the UV, so that they rapidly and efficiently absorb the laser irradiation.
They are functionalized with polar groups, allowing their use in aqueous solutions.
The matrix solution is mixed with the analyte (e.g. protein-sample). The organic solvent allows hydrophobic molecules to dissolve into the solution, while the water allows for water-soluble (hydrophilic) molecules to do the same. This solution is spotted onto a MALDI plate (usually a metal plate designed for this purpose). The solvents vaporize, leaving only the recrystallized matrix, but now with analyte molecules spread throughout the crystals. The matrix and the analyte are said to be co-crystallized in a MALDI spot.
2. Laser
The laser is fired at the crystals in the MALDI spot. The spot absorbs the laser energy and it is thought that primarily the matrix is ionized by this event. The matrix is then thought to transfer part of its charge to the analyte molecules (e.g. protein), thus ionizing them while still protecting them from the disruptive energy of the laser. Ions observed after this process are quasimolecular ions that are ionized by the addition of a proton to [M+H]+, or other cation such as sodium ion [M+Na]+, or the removal of a proton [M-H]- for example. MALDI generally produces singly-charged ions, but multiply charged ions ([M+nH]n+) can also be observed, usually in function of the matrix used and/or of the laser intensity, voltage. Note that these are all even-electron species. Ion signals of radical cations can be observed eg. in case of matrix molecules and other stable molecules.
Lasers Used for MALDI
Laser | Wavelength (nm) | Reference |
Nitrogen laser | 337 | (Tanaka 1988)[1] |
Nd:YAG | 355, 266 | (Karas 1985)[2] |
Er:YAG | 2940 | (Overberg 1990)[3] |
CO2 | 10,600 | (Overberg 1991)[4] |
3. AP-MALDI
Atmospheric pressure (AP) matrix-assisted laser desorption/ionization (MALDI) is an ionization technique (ion source) that in contrast to vacuum MALDI operates at normal atmospheric environment.[5] The main difference between vacuum MALDI and AP-MALDI is the pressure in which the ions are created. In vacuum MALDI, ions are typically produced at 10 mTorr or less while in AP-MALDI ions are formed in atmospheric pressure. Disadvantage of the AP MALDI source is the limited sensitivity observed and the limited mass range.
AP-MALDI is used in mass spectrometry (MS) in a variety of applications ranging from proteomics to drug discovery fields. Popular topics that are addressed by AP-MALDI mass spectrometry include: proteomics, DNA/RNA/PNA, lipids, oligosaccharides, phosphopeptides, bacteria, small molecules and synthetic polymers, similar applications as available also for vacuum MALDI instruments.
The AP-MALDI ion source is easily coupled to an ion trap mass spectrometer[6] or any other MS system equipped with ESI (electrospray ionization) or nanoESI source.
4. Mass spectrometer
The type of a mass spectrometer most widely used with MALDI is the TOF (time-of-flight mass spectrometer), mainly due to its large mass range. The TOF measurement procedure is also ideally suited to the MALDI ionization process since the pulsed laser takes individual ‘shots’ rather than working in continuous operation. MALDI-TOF instruments are typically equipped with an “ion mirror”, deflecting ions with an electric field, thereby doubling the ion flight path and increasing the resolution. Commercial reflectron TOF instruments reach today a resolving power m/Δm of well above 20’000 FWHM (full-width half-maximum, Δm defined as the peak width at 50% of peak height).
5. History
The term matrix-assisted laser desorption ionization (MALDI) was coined in 1985 by Franz Hillenkamp, Michael Karas and their colleagues.[7] These researchers found that the amino acid alanine could be ionized more easily if it was mixed with the amino acid tryptophan and irradiated with a pulsed 266 nm laser. The tryptophan was absorbing the laser energy and helping to ionize the non-absorbing alanine. Peptides up to the 2843 Da peptide melittin could be ionized when mixed with this kind of “matrix”.[8] The breakthrough for large molecule laser desorption ionization came in 1987 when Koichi Tanaka of Shimadzu Corp. and his co-workers used what they called the “ultra fine metal plus liquid matrix method” that combined 30 nm cobalt particles in glycerol with a 337 nm nitrogen laser for ionization.[9] Using this laser and matrix combination, Tanaka was able to ionize biomolecules as large as the 34,472 Da protein carboxypeptidase-A. Tanaka received one-quarter of the 2002 Nobel Prize in Chemistry for demonstrating that, with the proper combination of laser wavelength and matrix, a protein can be ionized.[10] Karas and Hillenkamp were subsequently able to ionize the 67 kDa protein albumin using a nicotinic acid matrix and a 266 nm laser.[11] Further improvements were realized through the use of a 355 nm laser and the cinnamic acid derivatives ferulic acid, caffeic acid and sinapinic acid as the matrix.[12] The availability of small and relatively inexpensive nitrogen lasers operating at 337 nm wavelength and the first commercial instruments introduced in the early 1990s brought MALDI to an increasing number of researchers.[13] Today, mostly organic matrices are used for MALDI mass spectrometry.
6. Use
6.1. In Biochemistry
In proteomics, MALDI is used for the identification of proteins isolated through gel electrophoresis: SDS-PAGE and two-dimensional gel electrophoresis. One method used is peptide mass fingerprinting by MALDI-MS, or with post ionisation decay or collision-induced dissociation (further use see mass spectrometry).
6.2. In Organic Chemistry
Some synthetic macromolecules, such as catenanes and rotaxanes, dendrimers and hyperbranched polymers, and other assemblies, have molecular weights extending into the thousands or tens of thousands, where most ionization techniques have difficulty producing molecular ions. MALDI is a simple and rapid analytical method that can allow chemists to analyze the results of such syntheses and verify their results.
7. Problems
The sample preparation for MALDI is important for the result. Inorganic salts which are also part of protein extracts interfere with the ionization process. The salts are removed by solid phase extraction or washing the final target spots with water. Both methods can also remove other substances from the sample. The matrix protein mixture is not homogenous because the polarity difference leads to a separation of the two substances during crystallization. The spot diameter of the target is much larger than that of the laser, which makes it necessary to do several laser shots at different places of the target, to get the statistical average of the substance concentration within the target spot. The matrix composition, the addition of trifluoroacetic acid and formic acid, delay between laser pulses, delay time of the acceleration power, laser wavelength, energy density of the laser and the impact angle of the laser on the target are among others the critical values for the quality and reproducibility of the method.
8. References
1. Tanaka, K.; Waki, H.; Ido, Y.; Akita, S.; Yoshida, Y.; Yoshida, T., Protein and Polymer Analyses up to m/z 100 000 by Laser Ionization Time-of flight Mass Spectrometry. Rapid Commun Mass Spectrom 1988, 2, 151-153.
2. Karas, M.; Bachmann, D.; Hillenkamp, F., Influence of the Wavelength in High-Irradiance Ultraviolet Laser Desorption Mass Spectrometry of Organic Molecules. Anal. Chem. 1985, 57, 2935-2939.
3. Overberg, A.; Karas, M.; Bahr, U.; Kaufmann, R.; Hillenkamp, F., Matrix-assisted Infrared-laser (2.94 μm) Desorption/Ionization Mass Spectrometry of Large Biomolecules. Rapid Commun. Mass Spectrom. 1990, 4, 293-296.
4. Overberg, A.; Karas, M.; Hillenkamp, F., Matrix-assisted Laser Desorption of Large Biomolecules with a TEA-CO2-Laser. Rapid Commun. Mass Spectrom. 1991, 5, 128-131.
5. Laiko VV, Baldwin MA, Burlingame AL (2000). “Atmospheric pressure matrix-assisted laser desorption/ionization mass spectrometry”. Anal. Chem. 72 (4): 652-7.
6. Laiko VV, Moyer SC, Cotter RJ (2000). “Atmospheric pressure MALDI/ion trap mass spectrometry”. Anal. Chem. 72 (21): 5239-43.
7. Karas, M.; Bachmann, D.; Hillenkamp, F. (1985). “Influence of the Wavelength in High-Irradiance Ultraviolet Laser Desorption Mass Spectrometry of Organic Molecules”. Anal. Chem. 57: 2935-9.
8. Karas, M.; Bachman, D.; Bahr, U.; Hillenkamp, F. (1987). “Matrix-Assisted Ultraviolet Laser Desorption of Non-Volatile Compounds”. Int J Mass Spectrom Ion Proc 78: 53-68.
9. Tanaka, K.; Waki, H.; Ido, Y.; Akita, S.; Yoshida, Y.; Yoshida, T. (1988). “Protein and Polymer Analyses up to m/z 100 000 by Laser Ionization Time-of flight Mass Spectrometry”. Rapid Commun Mass Spectrom 2 (20): 151-3.
10. Markides, K; Gräslund, A. Advanced information on the Nobel Prize in Chemistry 2002 (PDF).
11. Karas M, Hillenkamp F (1988). “Laser desorption ionization of proteins with molecular masses exceeding 10,000 daltons”. Anal. Chem. 60 (20): 2299-301.
12. Beavis RC, Chait BT (1989). “Matrix-assisted laser-desorption mass spectrometry using 355 nm radiation”. Rapid Commun. Mass Spectrom. 3 (12): 436-9.
13. Karas, M.; Bahr, U. (1990). “Laser Desorption Ionization Mass Spectrometry of Large Biomolecules”. Trends Anal. Chem. 9: 321-5.
ESI
Electrospray ionization (ESI) is a technique used in mass spectrometry to produce ions. It is especially useful in producing ions from macromolecules because it overcomes the propensity of these molecules to fragment when ionized. The development of electrospray ionization for the analysis of biological macromolecules[1] was rewarded with the attribution of the Nobel Prize in Chemistry to John Bennett Fenn in 2002.[2]
Contents
1. How it works
2. Ionization mechanism
3. Variants
4. Applications
4.1. Liquid chromatography–mass spectrometry
4.2. Noncovalent gas phase interactions
4.3. Colloid thrusters
4.4. Deposition of particles for nanostructures
5. References
6. External links
1. How it works
In electrospray ionization, a liquid is pushed through a very small, charged and usually metal, capillary.[3] This liquid contains the substance to be studied, the analyte, dissolved in a large amount of solvent, which is usually much more volatile than the analyte. Volatile acids, bases or buffers are often added to this solution too. The analyte exists as an ion in solution either in a protonated form or as an anion. Because like charges repel, the liquid pushes itself out of the capillary and forms an aerosol, a mist of small droplets about 10 μm across. The aerosol is at least partially produced by a process involving the formation of a Taylor cone and a jet from the tip of this cone. An uncharged carrier gas such as nitrogen is sometimes used to help nebulize the liquid and to help evaporate the neutral solvent in the droplets. As the solvent evaporates, the analyte molecules are forced closer together, repel each other and break up the droplets. This process is called Coulombic fission because it is driven by repulsive Coulombic forces between charged molecules. The process repeats until the analyte is free of solvent and is a lone ion. There is still debate about the exact mechanism of the process, particularly the last stage, when lone ions form. Lone ions move to the mass analyzer of a mass spectrometer.
In electrospray processes, the ions observed may be quasimolecular ions created by the addition of a proton (a hydrogen ion) and denoted [M+H]+, or of another cation such as sodium ion, [M+Na]+, or the removal of a proton, [M-H]-. Multiply-charged ions such as [M+2H]2+ are often observed. For large macromolecules, there can be many charge states, occurring with different frequencies; the charge can be as great as [M+25H]25+, for example. All these are even-electron ion species: electrons (alone) are not added or removed, unlike in some other ionizations. The formation of ions in electrospray is somewhat homologous to acid-base reactions. Redox reactions do occur and a circuit with measurable current flow exists, but atomic and molecular ions are the primary carriers of charge in the solution and gas phases.
2. Ionization mechanism
There are two major competing theories about the final production of lone ions, the charged residue model (CRM) and the ion evaporation model (IEM). [4]
Electrospray droplets start off highly charged, and as they shrink through evaporation the Coulomb repulsion forces approach the force of surface tension that holds droplet together. The droplet then becomes unstable and disintegrates into several droplets of smaller radius.
The Charged Residue Model suggests that electrospray droplets undergo evaporation and disintegration cycles, with each initial droplet leading to a multitude of much smaller “daughter” droplets. Each final “daughter” droplet contains on average one or less molecule of analyte. When the last solvent molecules evaporate from such droplet the analyte molecule is left with the charges that the droplet carried.
The Ion Evaporation (Desorption) Model suggests that as the droplet reaches a certain radius the field strength at the surface of the droplet becomes great enough to push or desorb ions directly out of the droplet. Characteristically, the fission event corresponds to an almost negligible loss in droplet mass, but a significant drop in charge.
It has been suggested that both models probably occur for different analytes/solvents and in the limit of both models they have a tendency to converge. That is to say that the distinction between a droplet containing an analyte molecule and an analyte molecule surrounded by a layer of solvent eventually disappears and coulombic fission looks a lot like ion evaporation. The real question is scale and timing and the techniques to definitively determine this are not yet available.
The use of the word “ionization” in “electrospray ionization” is criticized by some because many of the ions observed are thought to be preformed in solution before the electrospray process or created by simple changes in concentrations as the aerosolized droplets shrink. It is argued that electrospray is simply an interface for transferring ions from the solution phase to the gas phase.
3. Variants
There are many variations on the basic electrospray technique, that generally offer better sensitivity than it.[5] Two important ones are microspray (µ-spray) and nanospray.[6] The primary difference is in the reduced flow rate of the analyte containing liquid, µLiters/minute and nLiters/minute respectively; this causes many other differences, such as the reduced internal diameter of the tubing or lack of nebulization gas.
4. Applications
4.1. Liquid chromatography–mass spectrometry
Electrospray ionization is the primary ion source used in liquid chromatography-mass spectrometry because it is a liquid-gas interface capable of coupling liquid chomatography with mass spectrometry.
4.2. Noncovalent gas phase interactions
Electrospray ionization is also ideal in studying noncovalent gas phase interactions. The electrospray process is capable of transferring liquid-phase noncovalent complexes into the gas phase without disrupting the noncovalent interaction. This means that a cluster of two molecules can be studied in the gas phase by other mass spectrometry techniques. An interesting example of this is studying the interactions between enzymes and drugs which are inhibitors of the enzyme. Because inhibitors generally work by noncovalently binding to its target enzyme with reasonable affinity the noncovalent complex can be studied in this way. Competition studies have been done in this way to screen for potential new drug candidates.
4.3. Colloid thrusters
Electrospray techniques are used to control satellites, since the fine-controllable particle ejection allows precise and effective thrusts.
4.4. Deposition of particles for nanostructures
Electrospray may be used in nanotechnology, to deposit single particles on surfaces.[7] This is done by spraying colloids on average containing only one particle per droplet. The solvent evaporates, leaving an aerosol stream of single particles of the desired type. The ionizing property of the process is not crucial for the application but may be used in electrostatic precipitation of the particles.
5. References
1. Fenn, J. B.; Mann, M.; Meng, C. K.; Wong, S. F.; Whitehouse, C. M. (1989). “Electrospray ionization for mass spectrometry of large biomolecules.” Science 246: 64-71.
2. Markides, K; Gräslund, A. Advanced information on the Nobel Prize in Chemistry 2002.
3. Fenn, J. B.; Mann, M.; Meng, C. K.; Wong, S. F.; Whitehouse, C. M. (1990). “Electrospray Ionization-Principles and Practice”. Mass Spectrometry Reviews 9 (1): 37-70.
4. Kebarle P (2000). “A brief overview of the present status of the mechanisms involved in electrospray mass spectrometry”. Journal of mass spectrometry : JMS 35 (7): 804-17. 5. Grace,J. M.; Marijnissen, J. C. M.; A review of liquid atomization by electrical means. J Aerosol Sc, 1994, Volume 25, Issue 6, Pages 1005-1019.
6. Wilm M, Mann M (1996). “Analytical properties of the nanoelectrospray ion source”. Anal. Chem. 68 (1): 1-8.
7. Schulz, F.; Franzka, S.; Schmid, G.; Nanostructured Surfaces by Deposition of Metal Nanoparticles by Means of Spray Techniques. Advanced Functional Materials 2002, 12,532-536.
6. External links
Tandem mass spectrometry
Tandem mass spectrometry, also known as MS/MS, involves multiple steps of mass spectrometry selection, with some form of fragmentation occurring in between the stages.[1]
Contents
1. Tandem MS instruments
2. Notation
3. Fragmentation in tandem mass spectrometry
3.1. In-source fragmentation
3.2. Post-source fragmentation
4. Peptide fragmentation
5. Oligosaccharide fragmentation
6. Modes of tandem MS analysis
7. References
8. Bibliography
1. Tandem MS instruments
Multiple stages of m/z separation can be accomplished with individual mass spectrometer elements separated in space or in a single mass spectrometer with the MS steps separated in time. In tandem mass spectrometry in space, the separation elements are physically separated and distinct, although there is a connection between the elements to maintain high vacuum. These elements can be sectors, transmission quadrupole, or time-of-flight. In a tandem mass spectrometry in time instrument, the separation is accomplished with ions trapped in the same place, with multiple separation steps taking place over time. A quadrupole ion trap or FTMS instrument can be used for such an analysis. Trapping instruments can perform multiple steps of analysis, which is sometimes referred to as MSn (MS to the n). Often the number of steps, n, is not indicated, but occasionally the value is specified; for example MS3 indicates three stages of separation.
2. Notation
For tandem mass spectrometry in space, the different elements are often noted in shorthand.
Q – Quadrupole mass analyzer
q – Radio frequency collision quadrupole
TOF – Time-of-flight mass analyzer
B – Magnetic sector
E – Electric sector.
The notation can be combined to indicate various hybrid instrument, for example
QqQ – Triple quadrupole mass spectrometer
QTOF – Quadrupole time-of-flight mass spectrometer (also QqTOF)
BEBE – Four-sector (reverse geometry) mass spectrometer.
3. Fragmentation in tandem mass spectrometry
Fragmentation of gas-phase ions is essential to tandem mass spectrometry and occurs between different stages of mass analysis. There are many methods used to fragment the ions and can result in different types of fragmentation and thus different information about the structure and composition of the molecule.
3.1. In-source fragmentation
Often, the ionization process is sufficiently violent to leave the resulting ions with sufficient internal energy to fragment within the mass spectrometer. If the product ions persist in their non-equilibrium state for a moderate amount of time before auto-dissociation this process is called metastable fragmentation.[2] [3] Nozzle-skimmer fragmentation refers to the purposeful induction of in-source fragmentation by increasing the nozzle-skimmer potential on usually electrospray based instruments. Although in-source fragmentation allows for fragmentation analysis, it is not technically tandem mass spectrometry unless metastable ions are mass analyzed or selected before auto-dissociation and a second stage of analysis is performed on the resulting fragments. In-source fragmentation is often used in addition to tandem mass mass spectrometry (with post-source fragmentation) to allow for two steps of fragmentation in a pseudo MS3-type of experiment.[4]
3.2. Post-source fragmentation
Post-source fragmentation is most often what is being used in a tandem mass spectrometry experiment. Energy can also be added to the, usually already vibrationally excited, ions through post-source collisions with neutral atoms or molecules, the absorption of radiation, or the transfer or capture of an electron by a multiply charged ion. Collision-induced dissociation (CID), also called collisionally activated dissociation (CAD), involves the collision of an ion with a neutral atom or molecule in the gas phase and subsequent dissociation of the ion.[5][6] For example, consider
where the ion AB + collides with the neutral species M and subsequently breaks apart. The details of this process are described by collision theory.
If an electron is added to a multiply-charged positive ion, the Coulomb energy is liberated. Adding a free electron is called electron capture dissociation (ECD),[7] and is represented by
for a multiply-protonated molecule M. Adding an electron through an ion-ion reaction is called electron transfer dissociation (ETD),[8] and is represented by
The energy required for dissociation can be added by photon absorption, resulting in ion photodissociation and represented by
where hν represents the photon absorbed by the ion. Ultraviolet lasers can be used, but can lead to excessive fragmentation of biomolecules.[9] Infrared photons will heat the ions and cause dissociation if enough of them are absorbed. This process is called infrared multiphoton dissociation (IRMPD) and is often accomplished with a carbon dioxide laser and an ion trapping mass spectrometer such as a FTMS.[10] Blackbody radiation can also be used in a technique known as blackbody infrared radiative dissociation (BIRD).[11] In the BIRD method, the entire mass spectrometer vacuum chamber is heated to create infrared radiation.
4. Peptide fragmentation
Peptide fragmentation notation using the scheme of Roepstorff and Fohlman (1984).[12]A peptide sequence tag obtained by tandem mass spectrometry can be used to identify a peptide in a protein database.[13][14][15] A notation has been developed for indicating peptide fragments that arise from a tandem mass spectrum.[12] Peptide fragment ions are indicated by a, b, or c if the charge is retained on the N-terminus and by x, y or z if the charge is maintained on the C-terminus. The subscript indicates the number of amino acid residues in the fragment. Superscripts are sometimes used to indicate neutral losses in addition to the backbone fragmentation, * for loss of ammonia and ° for loss of water. Although peptide backbone cleavage is the most useful for sequencing and peptide identification other fragment ions may be observed under certain conditions. These include the side chain loss ions d, v, w and immonium ions. [16][17]
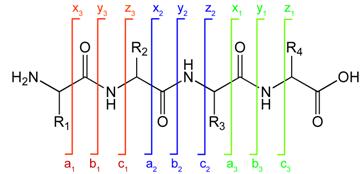
Peptide fragmentation notation using the scheme of Roepstorff and Fohlman (1984).[12]
5. Oligosaccharide fragmentation
Oligosaccharides may be sequenced using tandem mass spectrometry in a similar manner to peptide sequencing. Fragmentation generally occurs on either side of the glycosidic bond (b, c, y and z ions) but also under more energetic conditions through the sugar ring structure in a cross-ring cleavage (x ions). Again trailing subscripts are used to indicate position of the cleavage along the chain. For cross ring cleavage ions the nature of the cross ring cleavage is indicated by preceding superscripts.[18][19]
6. Modes of tandem MS analysis
In a product ion analysis, the first stage of mass spectrometry (MS1) is set to select a particular m/z and the second stage (MS2) records the mass spectrum of the fragments. The mass spectrum represents the fragments of the ion (or ions) of that particular m/z. In a precursor ion scan, MS2 is set to set to select a particular m/z and the mass spectral analysis is performed using MS1 to record the mass spectrum. The resulting spectrum records the ions that are the precursors in the fragmentation reaction that results in the m/z indicated by MS2. In a neutral loss scan, both MS1 and MS2 are in operation, but MS2 selects the same m/z as MS1, less the mass of the neutral. The resulting mass spectrum represents all m/z values that lose the neutral by fragmentation. In a selected-reaction monitoring (SRM) experiment, MS1 is set to select a particular precursor ion and MS2 is set to select one of its fragmentation products. SIM mode turns the mass spectrometer into an extremely selective detector when used in conjunction with a separation method, such as liquid chromatography mass spectrometry, for example.
7. References
1. IUPAC gold book definition of tandem mass spectrometer
2. IUPAC gold book definition of metastable ion (in mass spectrometry)
3. IUPAC gold book definition of transient (chemical) species
4. JAMS Vol. 7, Feb. 1996, pp 150-156
5. Wells JM, McLuckey SA (2005). “Collision-induced dissociation (CID) of peptides and proteins”. Meth. Enzymol. 402: 148-85.
6. Sleno L, Volmer DA (2004). “Ion activation methods for tandem mass spectrometry”. Journal of mass spectrometry : JMS 39 (10): 1091-112.
7. Cooper HJ, Håkansson K, Marshall AG (2005). “The role of electron capture dissociation in biomolecular analysis”. Mass spectrometry reviews 24 (2): 201-22.
8. Syka JE, Coon JJ, Schroeder MJ, Shabanowitz J, Hunt DF (2004). “Peptide and protein sequence analysis by electron transfer dissociation mass spectrometry”. Proc. Natl. Acad. Sci. U.S.A. 101 (26): 9528-33.
9. Morgan JW, Hettick JM, Russell DH (2005). “Peptide sequencing by MALDI 193-nm photodissociation TOF MS”. Meth. Enzymol. 402: 186-209.
10. Little DP, Speir JP, Senko MW, O’Connor PB, McLafferty FW (1994). “Infrared multiphoton dissociation of large multiply charged ions for biomolecule sequencing”. Anal. Chem. 66 (18): 2809-15.
11. Schnier PD, Price WD, Jockusch RA, Williams ER (1996). “Blackbody Infrared Radiative Dissociation of Bradykinin and Its Analogues: Energetics, Dynamics, and Evidence for Salt-Bridge Structures in the Gas Phase” 118 (30): 7178-7189. DOI:10.1021/ja9609157.
12. Roepstorff P, Fohlman J (1984). “Proposal for a common nomenclature for sequence ions in mass spectra of peptides”. Biomed. Mass Spectrom. 11 (11): 601. DOI:10.1002/bms.1200111109.
13. Hardouin J (2007). “Protein sequence information by matrix-assisted laser desorption/ionization in-source decay mass spectrometry”. Mass spectrometry reviews 26 (5): 672-82. DOI:10.1002/mas.20142.
14. Shadforth I, Crowther D, Bessant C (2005). “Protein and peptide identification algorithms using MS for use in high-throughput, automated pipelines”. Proteomics 5 (16): 4082-95. DOI:10.1002/pmic.200402091.
15. Mørtz E, O’Connor PB, Roepstorff P, Kelleher NL, Wood TD, McLafferty FW, Mann M (1996). “Sequence tag identification of intact proteins by matching tanden mass spectral data against sequence data bases”. Proc. Natl. Acad. Sci. U.S.A. 93 (16): 8264-7.
16. Richard S. Johnson, Stephen A. Martin and Klaus Biemann, Collision-induced fragmentation of (M + H)+ ions of peptides. Side chain specific sequence ions, International Journal of Mass Spectrometry and Ion Processes, Volume 86, 29 December 1988, Pages 137-154.
17. A. M. Falick, W. M. Hines, K. F. Medzihradszky, M. A. Baldwin and B. W. Gibson, Low-mass ions produced from peptides by high-energy collision-induced dissociation in tandem mass spectrometry, Journal of the American Society for Mass Spectrometry, Volume 4, Issue 11, November 1993, Pages 882-893.
18. Bruno Domon, Catherine E Costello (1988). “A systematic nomenclature for carbohydrate fragmentations in FAB-MS/MS spectra of glycoconjugates”. Glycoconj. J. 5 (4): 397-409.
19. Journal of Mass Spectrometry Volume 35, Issue 8 , Pages 1042 – 1048
8. Bibliography
• McLuckey, Scott A.; Busch, Kenneth L.; Glish, Gary L. (1988). Mass spectrometry/mass spectrometry: techniques and applications of tandem mass spectrometry. New York, N.Y: VCH Publishers. ISBN 0-89573-275-0.
• McLuckey, Scott A.; Glish, Gary L.. Mass Spectrometry/Mass Spectrometry: Techniques and Applications of Tandem. Chichester: John Wiley & Sons. ISBN 0-471-18699-6.
• McLafferty, Fred W. (1983). Tandem mass spectrometry. New York: Wiley. ISBN 0-471-86597-4.
• Sherman, Nicholas E.; Kinter, Michael (2000). Protein sequencing and identification using tandem mass spectrometry. New York: John Wiley. ISBN 0-471-32249-0.
LC-MS
Liquid chromatography-mass spectrometry (LC-MS) is an analytical chemistry technique that combines the physical separation capabilities of liquid chromatography with the mass analysis capabilities of mass spectrometry. LC-MS is a powerful technique used for many applications which has very high sensitivity and specificity. Generally its application is oriented towards the specific detection and potential identification of chemicals in the presence of other chemicals (in a complex mixture).
1. Liquid Chromatography
1.1. Scale
A major difference between traditional HPLC and the chromatography used in LC-MS is that in the latter case the scale is usually much smaller, both regarding internal diameter of the column and even more so with respect to flow rate since it scales as the square of the diameter. 1 mm columns were standard for LC-MS (as opposed to 4.6 mm for HPLC) for a long time. More recently 300μm and even “capillary” 75μm columns have become more prevalent. At the low end of these column diameters the flow rates approach 100nL/min and are generally used with nanospray sources.[1]
1.2. Flow Splitting
When standard bore (4.6 mm) columns are used the flow is often split ~10:1. This can be beneficial by allowing the use of other techniques in tandem such as MS and UV. However splitting the flow to UV will decrease the sensitivity of spectrophotometric detectors. The Mass Spec on the other hand will give improved sensitivity at flow rates of 200 μL/min or less. This is due to the fact that the analyte ions have to be vaporised (nebulized) in order to become charged. As the solvent flows into the MS the solvent evaporates and the gained charge remains, therefore the mass to charge ratio increases. This occurs until the charges repel each other in a process called Coulombic Explosion. If the above is not optimal for this process, the solvent does not evaporate and the ions do not become charged to the same extent. This results in a build up of solvent and uncharged ions in the source area of the MS, resulting in poor ionization and decreased sensitivity.
2. Mass Spectrometry
2.1. Mass Analyzer
Most mass spectrometers can be used in LC-MS however quadrupole and quadrupole ion traps are most common. Manufacturers of triple quadrupole mass spectrometers include Varian, Inc., MDS Sciex, Waters Corporation, Agilent, Shimadzu Scientific and Thermo Fisher Scientific.
2.2. Interface
Understandably the interface between a liquid phase technique which continuously flows liquid, and a gas phase technique carried out in a vacuum was difficult for a long time. The advent of electrospray ionization changed this. The interface is most often an electrospray ion source or variant such as a nanospray source; however fast atom bombardment, thermospray and atmospheric pressure chemical ionization interfaces are also used.[2] Various deposition and drying techniques have also been used such as using moving belts; however the most common of these is off-line MALDI deposition. [3][4]
3. Applications
3.1. Pharmacokinetics
LC-MS is very commonly used in pharmacokinetic studies of pharmaceuticals. These studies tell us how quickly a drug will be cleared from the Hepatic Blood flow, and organs of the body. MS is used for this due to high sensitivity and exceptional specificity compared to UV (as long as the analyte can be suitably ionised), and quick analysis time. The major advantage MS has is the use of Tandem MS-MS. You can program the detector to select out certain ions to fragment. The process is more complex than just a selection technique, but this is essentially what it does. This results in a response that is due to a chosen fragment of a molecule chosen by the operator and as long as there are no interferences or ion suppression the time taken during the LC separation can be quite quick. It is common now to have analysis times of 1 minute or less by MS-MS detection, compared to over 10 mins with UV detection.[5][6][7]
3.2. Proteomics
LC-MS is also used in the study of proteomics where again components of a complex mixture must be detected and identified in some manner. The bottom-up LC-MS approach to proteomics generally involves protease digestion (usually Trypsin) followed by LC-MS with peptide mass fingerprinting or LC-MS/MS (tandem MS) to derive sequence of individual peptides.
3.3. Drug Development
LC-MS is frequently used in drug development at many different stages including Peptide Mapping, Glycoprotein Mapping, Natural Products Dereplication, Bioaffinity Screening, In Vivo Drug Screening, Metabolic Stability Screening, Metabolite Identification, Impurity Identification, Degradant Identification, Quantitative Bioanalysis, and Quality Control.[8]
4. References
1. Capillary liquid chromatography/mass spectrometry, Kenneth B. Tomer, M. Arthur Moseley, Leesa J. Deterding, Carol E. Parker, Mass Spectrometry Reviews, Vol 13, 1994, pp 431-457
2. Combined liquid chromatography mass spectrometry. Part III. Applications of thermospray, Patrick Arpino, Mass Spectrometry Reviews, Vol 11, 1992 pp 3-40
3. Combined liquid chromatography mass spectrometry. Part I. Coupling by means of a moving belt interface, Patrick Arpino, Mass Spectrometry Reviews, Vol 8, 1989 pp 35-55
4. Coupling matrix-assisted laser desorption/ionization to liquid separations, Kermit K. Murray, Mass Spectrometry Reviews, Vol 16, pp 283-299
5. Increasing Speed and Throughput When Using HPLC-MS/MS Systems for Drug Metabolism and Pharmacokinetic Screening, Y. Hsieh and W.A. Korfmacher, Current Drug Metabolism Volume 7, Number 5, 2006, Pp. 479-489
6. Covey TR, Lee ED, Henion JD. 1986. High-speed liquid chromatography/tandem mass spectrometry for the determination of drugs in biological samples. Anal Chem 58:2453-2460.
7. Thermospray liquid chromatography/mass spectrometry determination of drugs and their metabolites in biological fluids. Covey TR et al. Anal Chem. 1985 Feb;57(2):474-81
8. LC/MS applications in drug development, Mass Spectrometry Reviews, Mike S. Lee, Edward H. Kerns, Vol 18, 1999, pp 187-279
